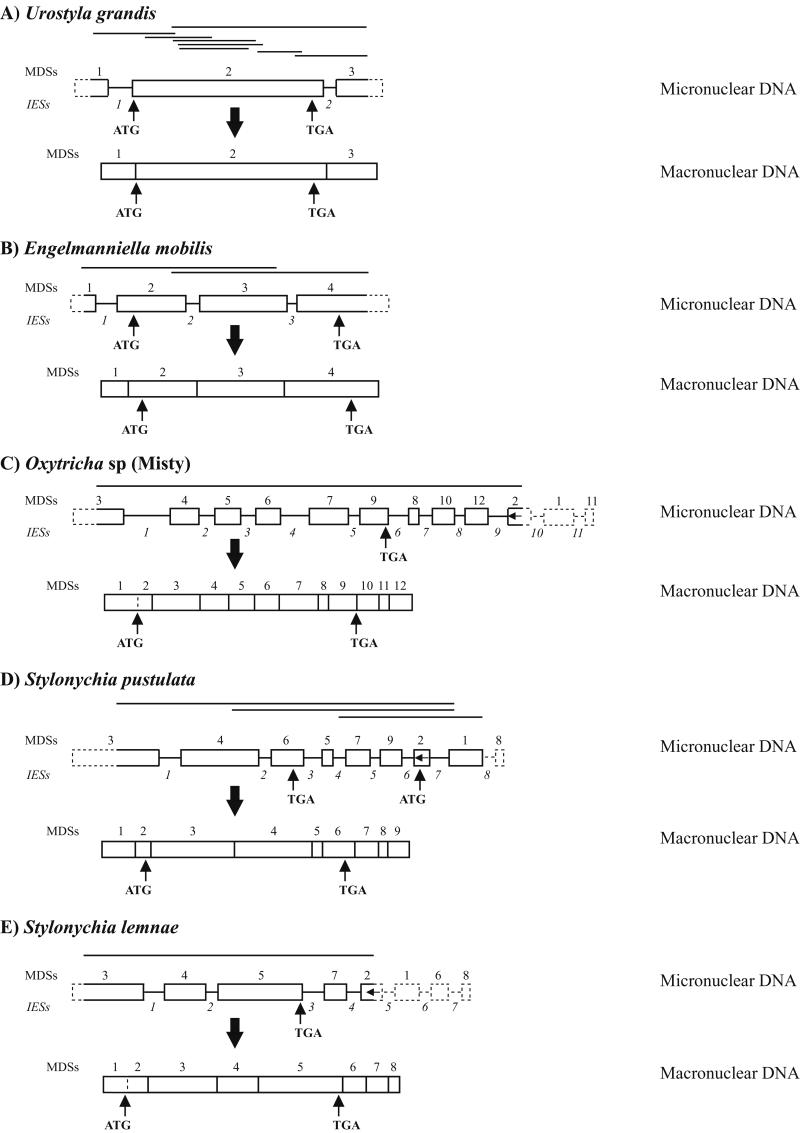
Figure 1.
Structure of micronuclear and macronuclear actin I genes in U. grandis (A), E. mobilis (B), Oxytricha sp. (Misty) (C), S. pustulata (D), and S. lemnae (E). Micronuclear DNA PCR products are indicated by lines above each micronuclear gene. MDSs are blocks and IESs are lines between blocks. Unsequenced regions are indicated by dashed blocks and dashed lines.

