Figure 1.
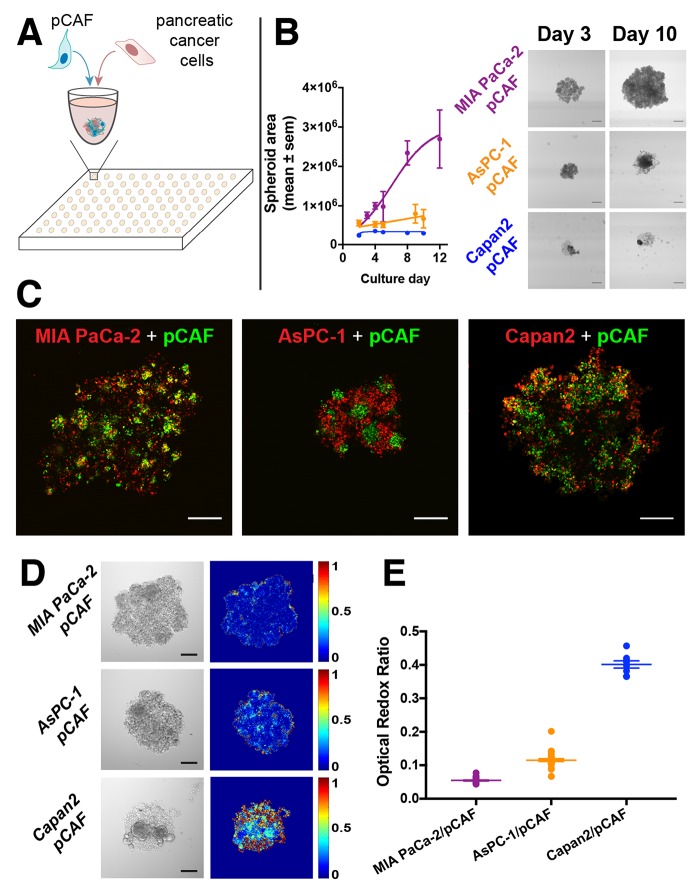
(A) Pancreatic cancer cell lines (MIA PaCa-2, Capan2 and AsPC-1) were co-cultured with patient derived pancreatic cancer associated fibroblasts (pCAF) in U bottom, ultra-low adhesion 96-well plates. (B) After cell seeding, the spheroids were regularly imaged (scale bar: 400μm) and their surface was plotted (in μm2) as a function of the time. MIA PaCa-2/pCAF culture is displayed in purple, the AsPC-1/pCAF in orange and the Capan2/pCAF in blue. (C) A staining assay leveraging the exceptionally high 2-photon absorption cross-section of quantum dots was developed to identify, here on day 2, the internal architecture of the spheroids and investigate the relative disposition of each cell type: PanCa cell line being depicted in red while pCAF are represented in green (Scale bar: 200μm). In both MIA PaCa-2/pCAF and AsPC-1/pCAF models, the pCAF form dense pockets surrounded by PanCa cell lines. However, in the case of Capan2/pCAF cultures, the two cell lines are more homogeneously distributed within the culture. (D) Representative bright-field images (scale bar = 200μm) and Optical Redox Ratio (ORR) heatmaps of untreated spheroids, measured on day 3. (E) Quantification of the spheroids ORR (mean ± sem) assessed on day 3 (no treatment applied).

