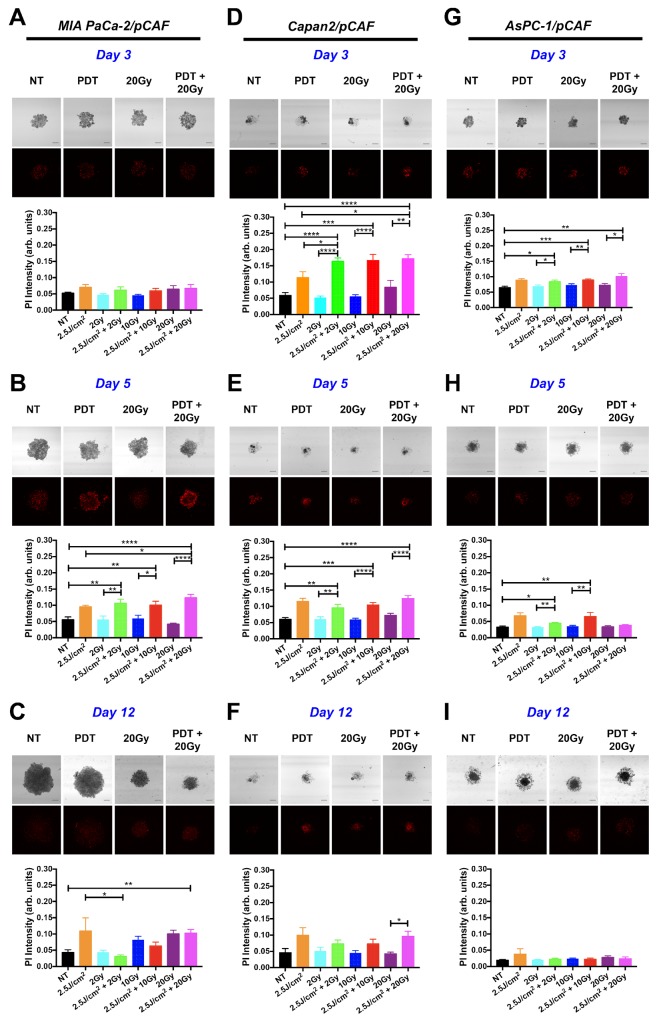
Figure 3. Necrotic population generated in the spheroids by individual or combination treatments.
For each type of culture: MIA PaCa-2/pCAF (A, B, and C), Capan2/pCAF (D, E, and F) or AsPC-1/pCAF (G, H, and I), a PI-staining protocol was performed in order to assess the necrotic population using subsequent confocal microscopy; those assays were performed on day 3 (4 hours post treatment; A, D and G), on day 5 (2 days post-treatment; B, E and H) or on day 12 (9 days post treatment; C, F and I). For each condition, a representative PI fluorescence image is presented side-by-side with the associated bright-field image (Scale bar= 400μm) for a few selected conditions: the untreated control (NT), the PDT alone (2.5J/cm2), a 20 Gy RT alone, and a 20Gy RT combined with a 2.5J/cm2 PDT (PDT+20Gy). For each condition, quantitative data is represented on bar graphs where the PI fluorescence intensity averaged over the entire spheroid area is plotted for each treatment condition. For each group, N>6 spheroids coming from at least 2 biological repeats; the data represents the mean +/- standard error.

