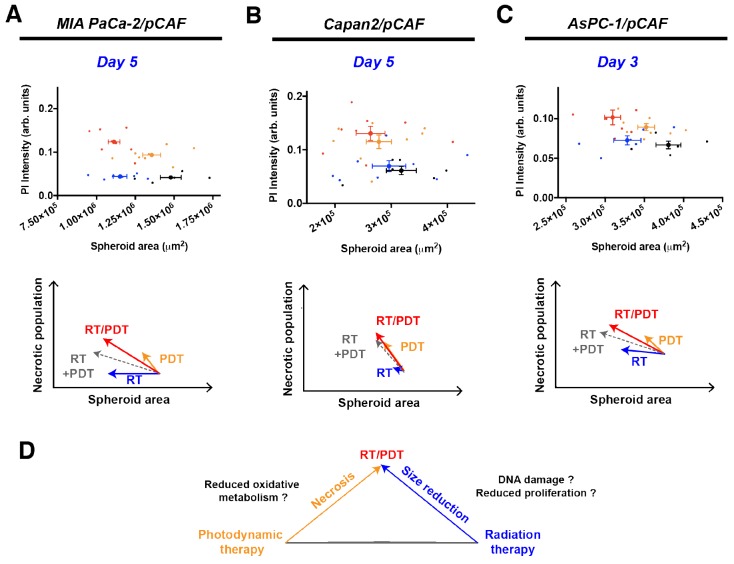
Figure 4.
Correlation between the PI intensity, i.e. the necrotic content, and the area of the spheroids for MIA PaCa-2/pCAF (A), Capan2/pCAF (B) and AsPC-1/pCAF (C) cultures. For each culture type, four conditions are represented: the untreated control group (black), 2.5J/cm2 PDT (orange), 20Gy RT (blue) and the combination of 2.5J/cm2 PDT with 20 Gy RT (red). For each condition, individual spheroids are represented by a thin scatter whereas a thicker scatter is used to represent the mean (+/- SEM) for each treatment group. The geometric sum of each effect is represented by a dashed grey arrow that represents the direct sum of the RT and PDT effects. In (D) is represented a schematic drawing of the effect of each individual treatment, emphasizing that a RT/PDT combination leads to smaller and more necrotic spheroids.

