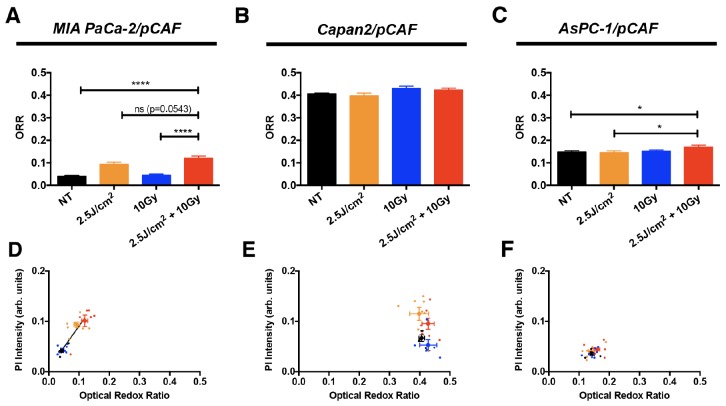
Figure 7.
The ORR (mean +/- SEM) has been assessed on day 5, i.e. 2 days post-treatment, on untreated spheroids and spheroids that received 2.5 J/cm2 of PDT, 10 Gy of RT or a combination of 2.5 J/cm2 of PDT and 10 Gy RT, for (A) MIA PaCa-2/pCAF cultures, (B) Capan2/pCAF and (C). AsPC-1/pCAF. A correlation between the size of the spheroids and their ORR was represented for the same cultures: (D) MIA PaCa-2/pCAF cultures, (E) Capan2/pCAF and (F) AsPC-1/pCAF; where the untreated controls are represented in black, the PDT treated samples in orange, the spheroids that received 10Gy RT are in blue and the cells that received a combination of RT/PDT are depicted in red. For each treatment group, each spheroid is represented by a small scatter and the average value (mean +/- SEM) calculated for each treatment group is represented by a thicker point.

