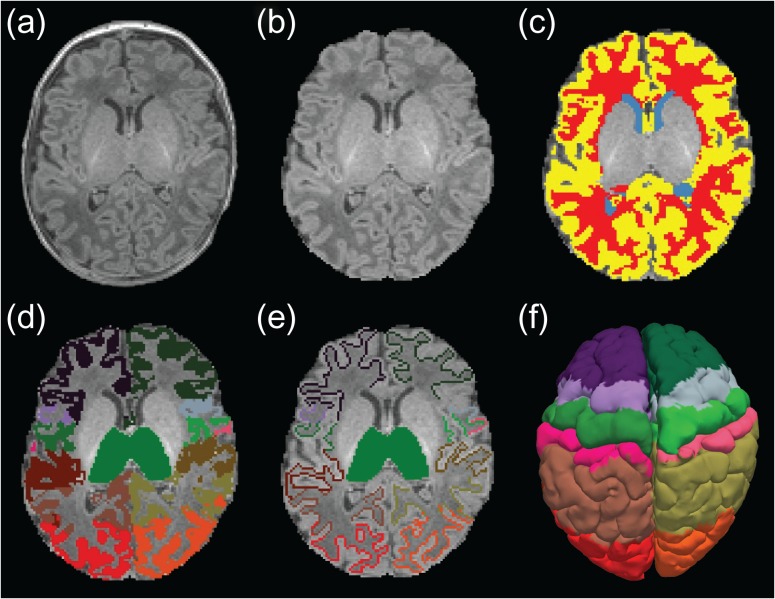
Figure 1.
Anatomical images of a single subject and its corresponding segmentations in native space. (a) Original T1-weighed MRI, (b) brain extracted MRI, (c) automatically generated anatomical masks: CSF (blue), WM (red), GM (yellow), and thalamic and cortical labels used for (d) functional connectivity and (e) probabilistic tractography analysis. (f) Pial cortical surface showing cortical regions used for connectivity analysis (following FreeSurfer standard color lookup table).

