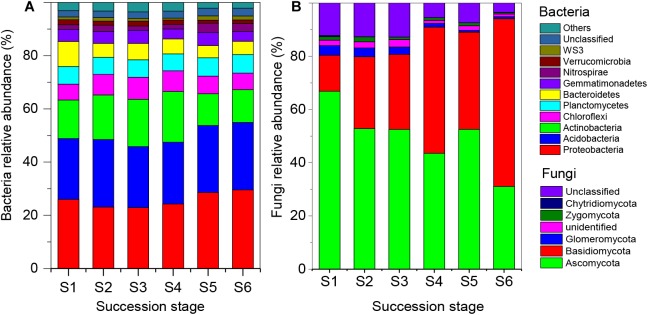
FIGURE 2.
Relative abundance of soil bacterial (A) and fungal (B) communities at the phylum level across the six successional stages (S1–S6 represent 1–4, 4–8, 8–15, 15–50, 50–100, and 100–150 years after abandonment, respectively). The abundance of each taxon in relation to the abundance of all the taxa was calculated as the relative abundance (based on the data of sequence analysis).

