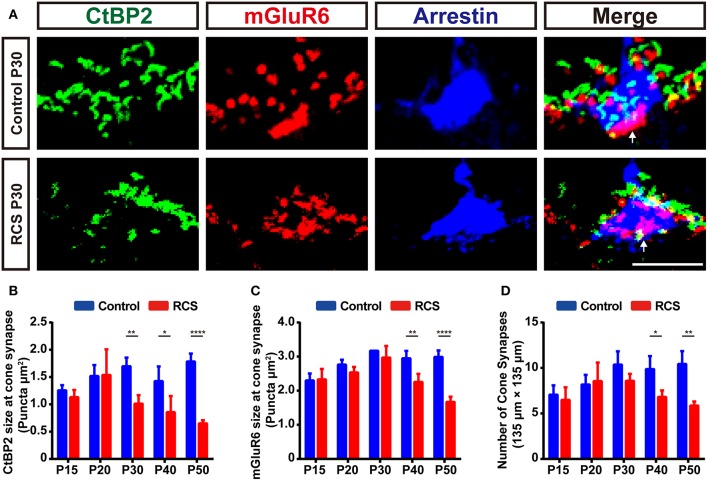
Figure 2.
Early cone synapse loss in the OPL during retinal degeneration in RCS rats. (A) Immunostaining for CtBP2 (green), mGluR6 (red) and cone arrestin (blue) in the retinas of control and RCS rats at P30. White arrows indicate cone synapses. (B–C) Quantification of the changes in the size of cone synaptic puncta positive for CtBP2 and mGluR6 in control and RCS rats at P15, P20, P30, P40, and P50 (N = 3–4 eyes from different rats, n = 9–15 images from each eye). (D) Quantification of the changes in the number of cone synapse in control and RCS rats at P15, P20, P30, P40, and P50 (N = 3–4 eyes from different rats, n = 9–15 images from each eye). Scale bar, 5 μm (A). Bars represent means; error bars represent SD. *p < 0.05, **p < 0.01, ****p < 0.0001 using two-way ANOVA (B–D).

