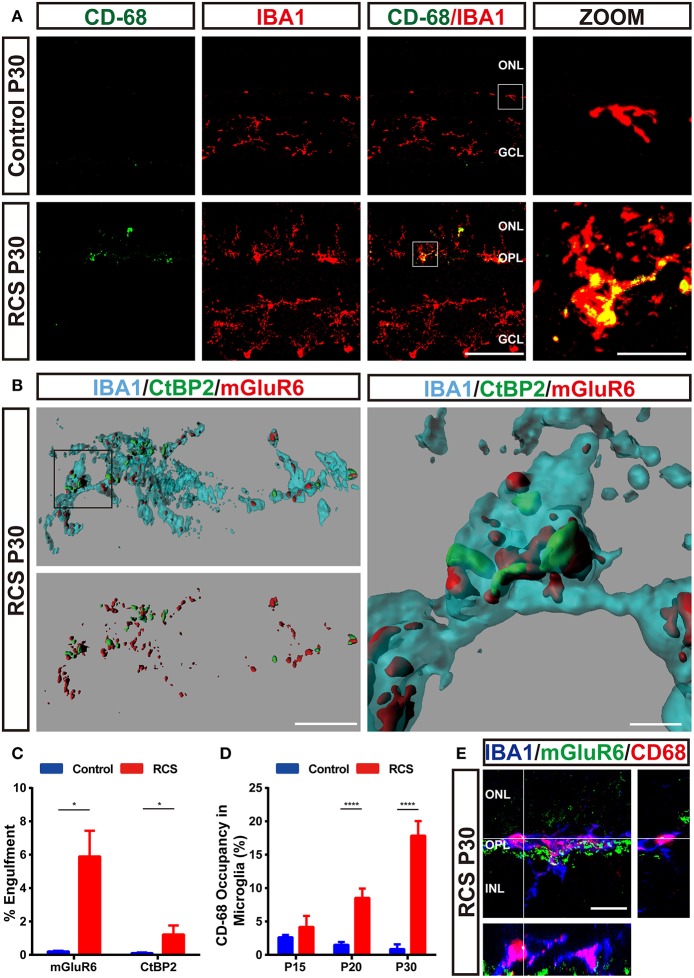
Figure 5.
Engulfment of pre- and postsynaptic elements of RBCs by microglia in the retina of RCS rats. (A) Immunostaining for IBA1 (red) and CD-68 (green) in the retinas of P30 control and RCS rats suggested that retinal degeneration induced high levels of CD68 (green) immunoreactivity in Iba1-positive (red) microglia in the OPL. (B,C) Three-dimensional reconstruction and surface renderings prepared using Imaris revealed larger volumes of synaptic puncta inside microglia in the RCS OPL, particularly postsynaptic mGluR6 puncta, compared with controls (N = 3 eyes from different rats, n = 15–20 microglia from each retina). (D) Quantification of % volume of microglia occupied by CD68-positive lysosomes in the OPL of control and RCS rats at P15, P20, and P30 (N = 3 eyes from different rats, n = 10–15 microglia from each retina). (E) An orthogonal view of a representative high-resolution confocal image showed colocalization of mGluR6 (green) within the CD68-immunoreactive lysosomal compartment (red) of an Iba1-positive microglial cell (blue). ONL, outer nuclear layer; OPL, outer plexiform layer; INL, inner nuclear layer; IPL, inner plexiform layer; GCL, ganglion cell layer. Scale bar, 50 μm (A), 10 μm (A,B,E) or 1 μm (B). Bars represent means; error bars represent SD. *p < 0.05; ****p < 0.0001 using an independent two-samples t-test (C) or two-way ANOVA (D).

