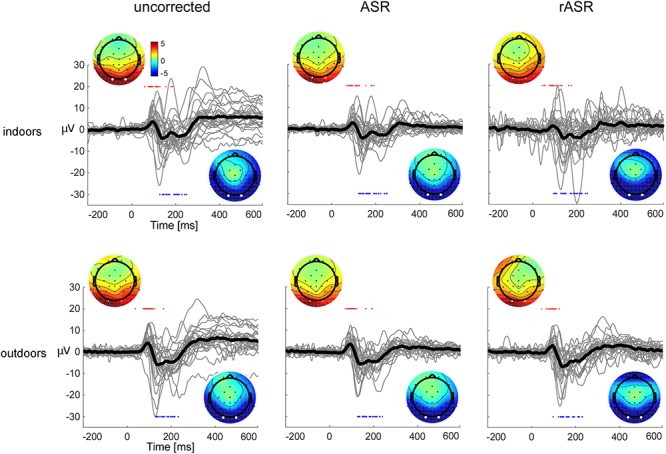
Figure 2.

Single subject (gray lines) and grand average (black lines) visual-evoked potentials, shown for uncorrected data (left) and following correction with ASR and rASR (center column and right). VEPs are shown for indoors and outdoors data and show the arithmetic mean of occipital channels O1 and O2, referenced to a central reference near Cz. The voltage maps show the averaged single subject topographies at subject-specific latencies for the early P1 and the later N1 response, all topographies are scaled identically. Individual latencies are indicated by red (P1) and blue (N1) dots. In the uncorrected data, one channel (right temporal T8) was interpolated for the voltage map.
