Figure 4.
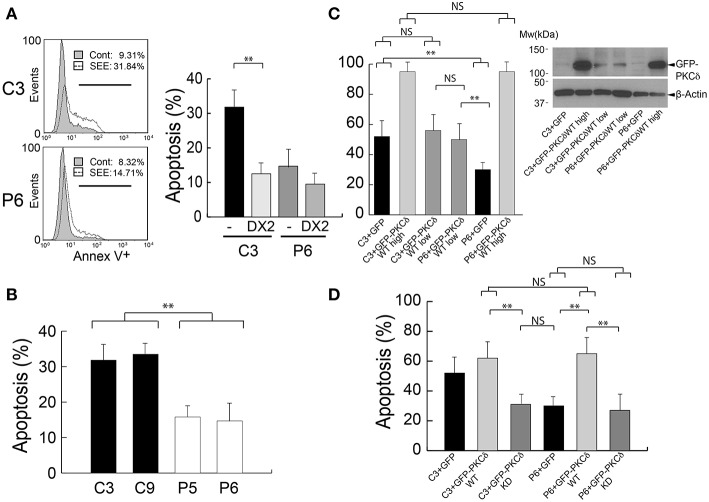
PKCδ regulates AICD. (A) Left panel, C3 control and P6 PKCδ-interfered Jurkat clones were challenged either with CMAC-labeled non-pulsed (Cont) or SEE-pulsed (SEE) Raji cells for 6 h, and the percentage of Annexin-V+ apoptotic cells (line marker) was determined by flow cytometry analysis after gating to exclude CMAC+ Raji cells. Right panel, same as left panel, but the Jurkat clones were preincubated or not (–) with blocking anti-Fas antibody (DX2) before the challenge with SEE-pulsed Raji cells. Data are means of the percentage of apoptosis plus SD obtained from several experiments (n = 3). (B) C3, C9 (control) and P5, P6 (PKCδ-interfered) Jurkat clones were challenged as in (A), and the percentage of Annexin-V+ apoptotic cells was determined by flow cytometry analysis after gating to exclude CMAC+ Raji cells. Data are means of the percentage of apoptosis plus SD obtained from several experiments (n = 3). (C) Left panel, C3 control and PKCδ-interfered P6 Jurkat clones transfected with GFP or different amounts of GFP-PKCδWT expression plasmids (high = 30 μg, low = 10 μg) were challenged with CMAC-labeled, SEE-pulsed Raji cells for 12 h, and apoptosis induction was assessed in the transfected cells as shown in (B). Right panel, WB analysis of GFP-PKCδ expression in cells used in the experiment from the left panel. (D) C3 control and P6 PKCδ-interfered Jurkat clones were transfected with the indicated expression plasmids and were challenged with CMAC-labeled, SEE-pulsed Raji cells for 12 h and apoptosis induction in the transfected cells was assessed as shown in (B,C). Data are means plus SD (n = 3). Single-factor ANOVA was performed between the indicated groups. NS, not significant; **p ≤ 0.05.

