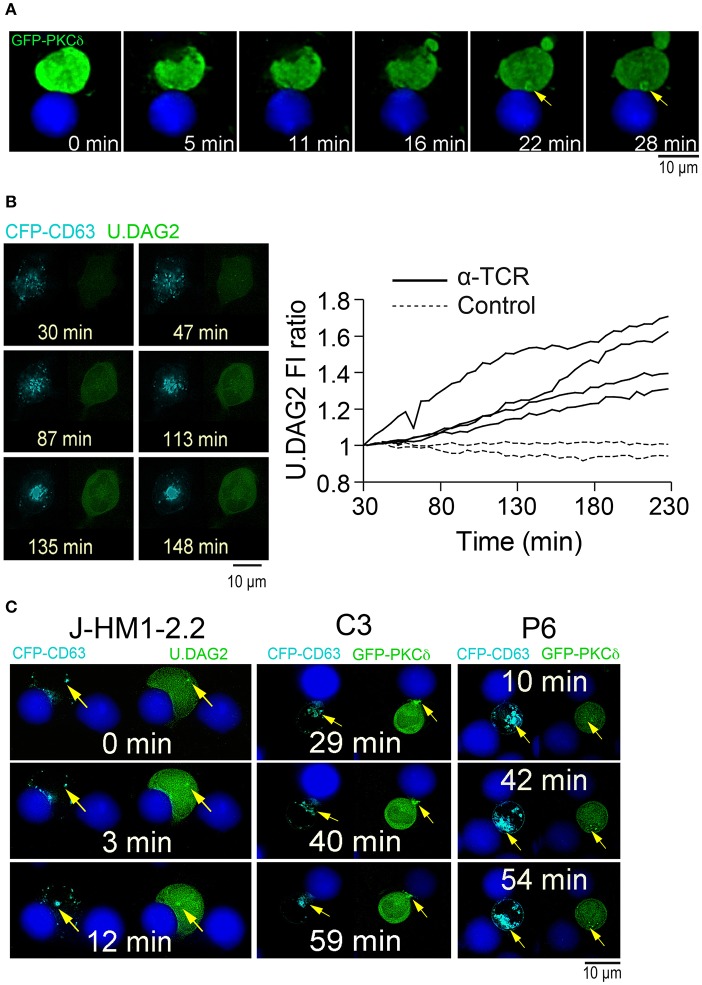
Figure 5.
Subcellular localization of GFP-PKCδ and U.DAG2 upon activation. (A) C3 control Jurkat clone expressing GFP-PKCδWT was challenged with CMAC-labeled, SEE-pulsed Raji cells and the synaptic conjugates imaged by time-lapse fluorescence microscopy. Relevant frames corresponding to Supplementary Video 2 (top right panel) are shown. The yellow arrow indicates accumulation of GFP-PKCδ (B) J-HM1-2.2 cells co-expressing CFP-CD63 and U.DAG2 were untreated (Control) or challenged with plate-bound anti-TCR (α-TCR), imaged by time-lapse fluorescence microscopy, and the U.DAG2 FI ratio was calculated. Left panels show relevant frames of two fluorescence channels corresponding to the 2nd time-lapse video from concatenated (Supplementary Video 4) (TCR stimulation). Right panel, U.DAG2 FI ratio was calculated as the average FI corresponding to each cell ROI at different times relative to the average FI at t = 30 min (FI at the indicated time point/FI at t = 30 min) and corresponded to untreated cells (n = 2, discontinuous lines) and cells challenged with plate-bound anti-TCR (n = 4, continuous lines). (C) J-HM1-2.2 cells co-expressing CFP-CD63 and U.DAG2 (left panels), and C3 control and P6 PKCδ-interfered Jurkat clones co-expressing CFP-CD63 and GFP-PKCδ (right panels) were challenged with CMAC-labeled, SEE-pulsed Raji cells and imaged by time-lapse microscopy. Relevant frames corresponding to J-HM1-2.2 cells (Supplementary Video 5), C3 control clone (Supplementary Video 2, top left panel) and P6 PKCδ-interfered clone (Supplementary Video 2, lower right panel) are shown. The yellow arrow indicates the accumulations of MVB, U.DAG2 and GFP-PKCδ. CMAC labeling of Raji cells in blue, CFP-CD63 in cyan and U.DAG2 or GFP-PKCδ in green. Scale bars, 10 μm.

