Figure 6.

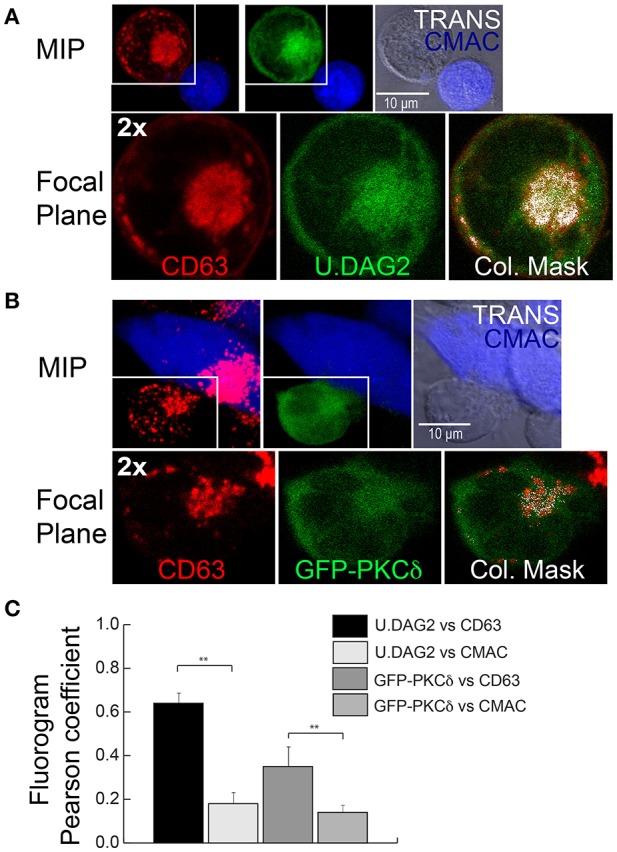
Colocalization analysis of GFP-PKCδ, U.DAG2 and CD63. (A) J-HM1-2.2 cells expressing U.DAG2 were challenged with CMAC-labeled SEE-pulsed Raji cells. After 1 h of conjugate formation, fixed cells were immunolabeled with anti-CD63 Ab to visualize the MVB and imaged by confocal microscopy. Maximal Intensity Projection (MIP) (top row), representative single focal plane (Z = 7, 2x zoom, bottom row) and colocalization mask of the same field are shown. The right-hand bottom panel shows the merged images with structures containing both CD63 and U.DAG2 appearing white (Pearson's correlation coefficient of fluorogram = 0.69). (B) P6 PKCδ-interfered clone expressing GFP-PKCδ was challenged with CMAC-labeled SEE-pulsed Raji cells. After 1 h, fixed cells were immunolabeled and imaged as in (A) MIP (top row), representative single focal plane (Z = 5, 2x zoom, bottom row) and colocalization mask (Pearson's correlation coefficient of fluorogram = 0.26) of the same field are shown. CMAC labeling of Raji cells in blue, CD63 in red and U.DAG2 or GFP-PKCδ in green. Scale bars, 10 μm. (C) C3 control clone expressing U.DAG2 or GFP-PKCδ were challenged as in (A) for 1 h, fixed and immunolabeled with anti-CD63. In control experiments developed in parallel, Jurkat cells were preloaded with CMAC, and the respective correlation coefficients of GFP-PKCδ and U.DAG2 with respect to cytosolic CMAC (as a negative control for colocalization analyses) were analyzed. Immuno-labeled cells were imaged by confocal microscopy and pairwise, Pearson's correlation coefficient of scatter-plot (fluorogram) between the indicated channels was calculated as indicated in Material and Methods. Results are expressed as means plus SD (n = 3) analyzing at least 20 synapses per experiment. Single-factor ANOVA was performed between the indicated groups. **p ≤ 0.05.
