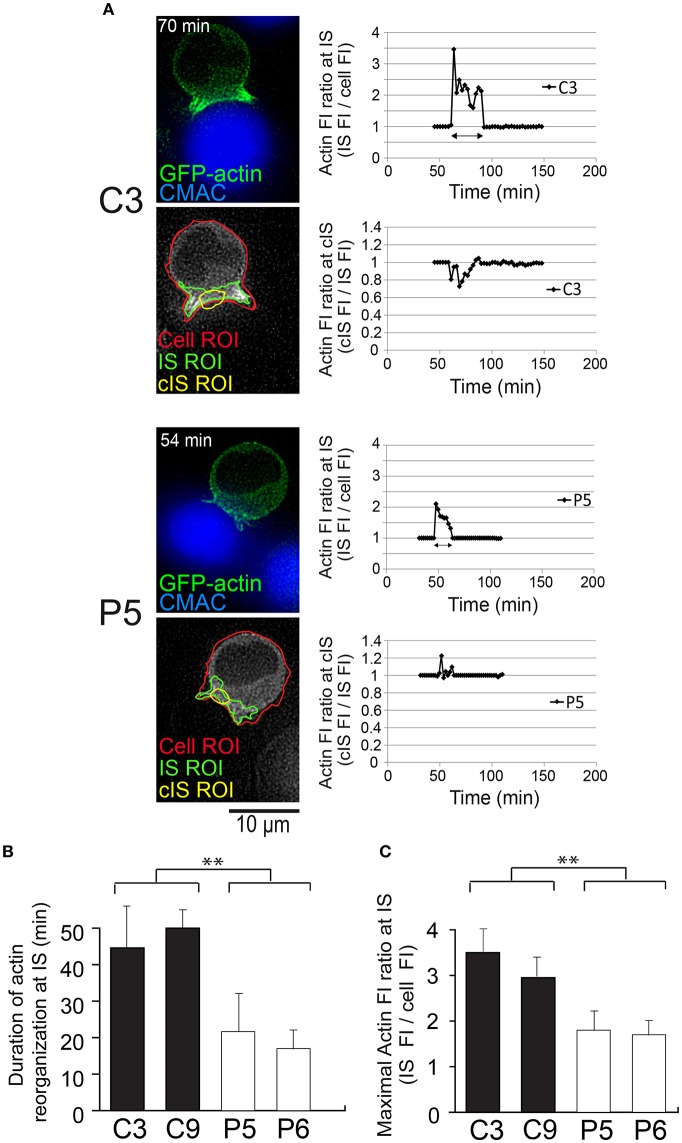
Figure 8.
Kinetic analysis of cortical actin reorganization at the IS in PKCδ-interfered cells. C3, C9 (control) and P5, P6 (PKCδ-interfered) clones expressing GFP-actin were challenged with CMAC-labeled SEE-pulsed Raji cells and imaged by time-lapse fluorescence microscopy. (A) Kinetic image analysis to evaluate actin FI ratio at the synapse (IS) and at the central synapse (cIS) using the indicated ROIs (cell ROI, red line; synapse ROI, green line; central synapse ROI, yellow line) for C3 and P5 clones asynchronously developing synapses. Representative frames from Supplementary Video 9 at the indicated times after the addition of clones to the SEE-pulsed Raji cells and below the corresponding, superimposed ROIs, are depicted (left panels) as a reference. Kinetic analyses of the relative cortical actin FI at the IS (IS FI/cell FI) and at the cIS (cIS FI/IS FI) are shown (right graphs) for C3 (upper graphs) and P5 (lower graphs). The time t = 0 of the X axis scale corresponds to the addition of clones to the SEE-pulsed Raji cells, which occurred 45 min (for C3) and 30 min (for P5) before the beginning of the time-lapse capture (thick lines in the graphs) of Supplementary Video 9. The beginning of conjugate formation, which corresponds to the peak of actin FI ratio at the IS, occurred at 62 min (17 plus 45 min) for the C3 clone and 46 min (16 plus 30 min) for the P5 clone after the addition of clones to the SEE-pulsed Raji cells. Double-headed dark arrows correspond to the time intervals during which actin ratio values were different to 1 (i.e., length of the actin reorganization period). CMAC labeling of Raji cells in blue and GFP-actin in green. Scale bars, 10 μm. (B) Results are expressed as average duration of the interval of actin reorganization for C3, C9 (control) and P5, P6 (PKCδ-interfered) clones. (C) Same as (B) but results are expressed as average maximal actin FI ratio at the IS. Data are means plus SD (n = 3, analyzing at least 12 synapses from several different microscopy fields per experiment). Single-factor ANOVA was performed between the indicated groups. **p ≤ 0.05. This figure is related to Supplementary Video 9.

