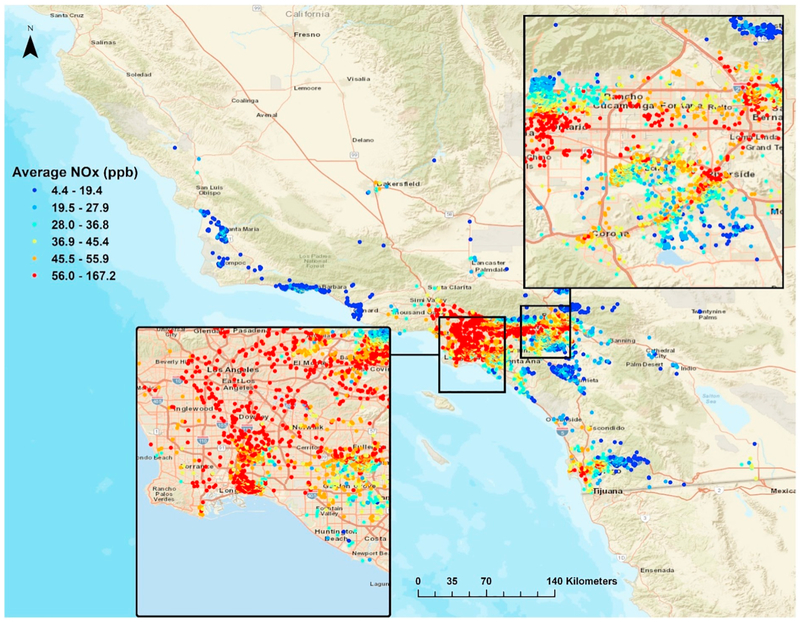
Fig. 1.
Average NOx (ppb) for southern California Children's Health Study (CHS) residential locations, 1992–2012. Average NOx using stage 3 of the Li et al. (2017) model which uses the averaged stage 2 NOx estimates and constrained optimization to re-predict exposure based on physical constraints meant to mimic known or observed real-life behavior of NOx. Average NOx for each unique CHS location displayed using quantiles (6).

