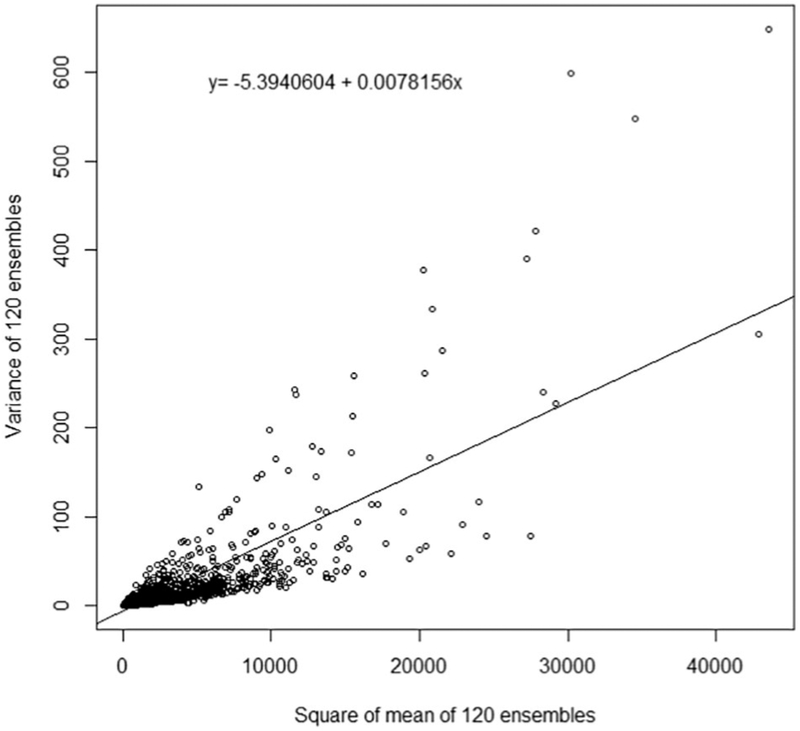
Fig. 3.

Scatter plot of prediction variance by square of mean to visualize unshared exposure measurement error. The variance and square of mean for each prediction across 120 ensembles are used to demonstrate unshared error. The intercept of the ordinary least squares regression line to fit the data is −5.39 with a slope of 0.0078. The negative intercept indicates there is no evidence of additive unshared error and the significant slope (p < 0.0001) indicates significant multiplicative unshared error.
