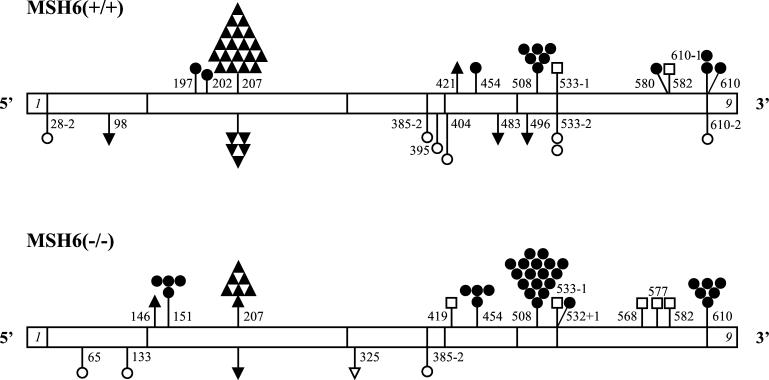
Figure 2.
Spectrum of hprt gene mutations in MSH6(+/+) and MSH6(−/−) cells. cDNA structure of the hprt gene is shown (only exons 1 and 9 are indicated). Exon 1 begins at base pair 1, and exon 9 ends at base pair 657. Mutations are represented by the following symbols: ▴, insertion of one nucleotide; ▾, deletion of one nucleotide; ▿, deletion of two nucleotides; ●, transition at C⋅G base pairs; ○, transition at A⋅T base pairs; □, transversion. Numbers indicate position of the mutated nucleotides. Position of the mutated nucleotides in the intron sequences is indicated as the cDNA position − or + the appropriate number of nucleotides into the introns.

