
FIGURE 2.
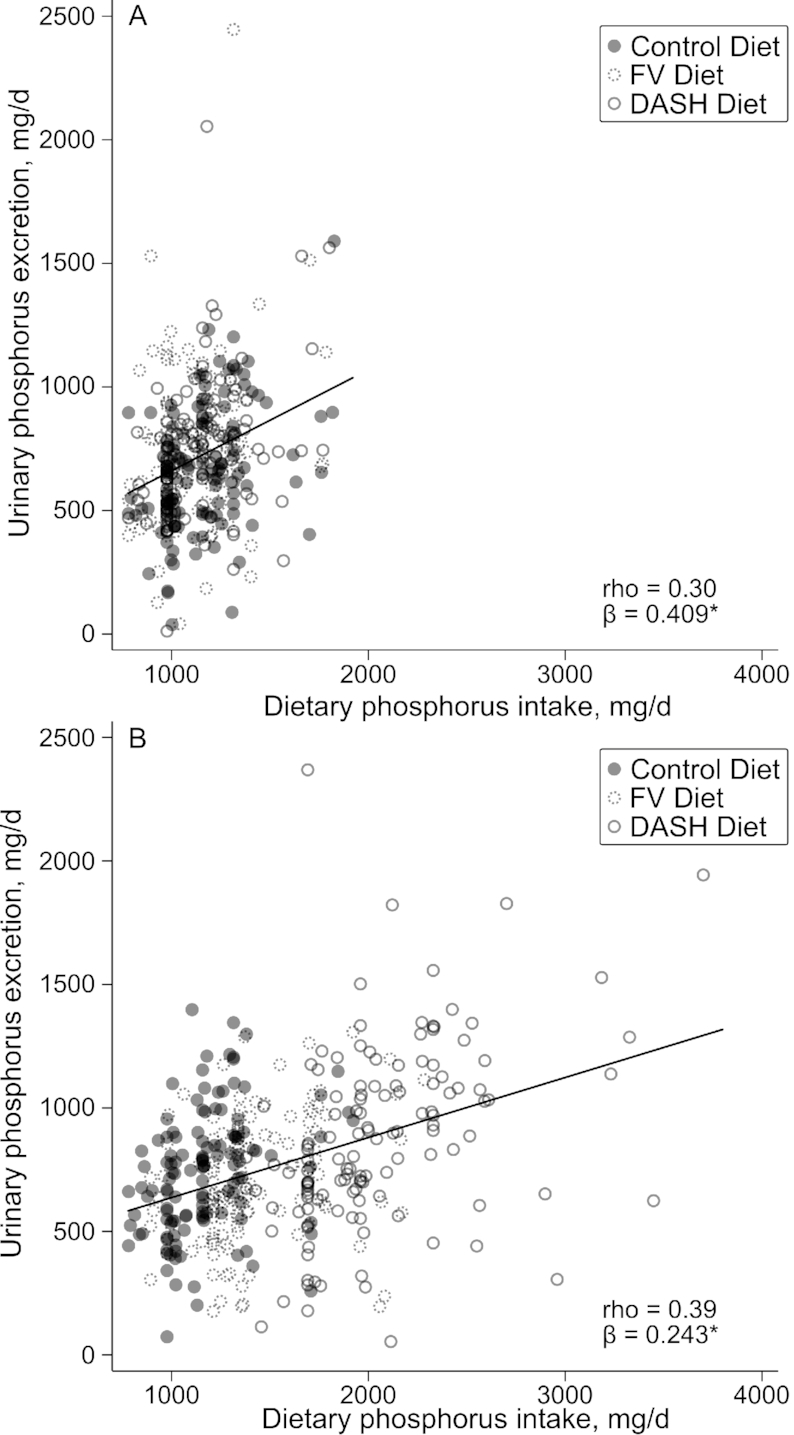
Correlation of urinary phosphorus excretion with dietary phosphorus intake, estimated from composite samples, at (A) the end of the run-in and (B) the end of the intervention in adults randomly assigned to consume the control, fruits and vegetables, or DASH diet. Values are mean individual dietary phosphorus intake for a given study period by composite sample analysis (milligrams per day) and urinary phosphorus excretion from a single 24-h urine collection (milligrams per day). β coefficient and trend line from linear regression of urinary phosphorus excretion on dietary phosphorus intake. *P < 0.001. DASH, Dietary Approaches to Stop Hypertension; FV, fruits and vegetables; rho, Spearman's correlation coefficient.