
FIGURE 2.
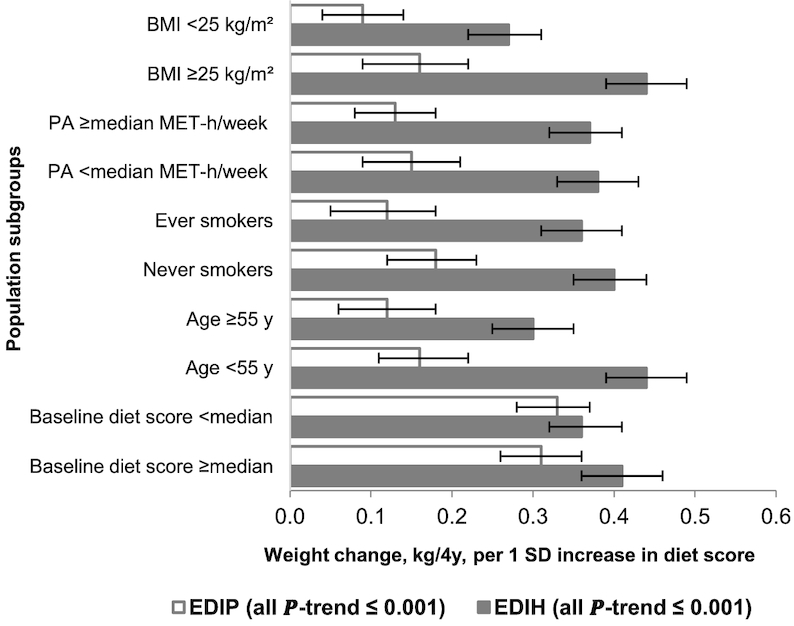
Multivariable-adjusted weight change (kilograms per 4 y) in men for each 1 SD increment in the change in dietary insulinemic (EDIH) and inflammatory (EDIP) potential, stratified by selected characteristics. Values are mean (95% CI) weight change in each 4-y interval. Analyses were adjusted for age, questionnaire cycle, baseline total energy intake, changes in total energy intake, baseline dietary insulinemic or inflammatory potential at the beginning of each 4-y period, baseline BMI, baseline physical activity, changes in physical activity, baseline hours of sleep per day, hours of sitting and watching TV per week (baseline only in NHS), 4-y change in alcohol consumption, and 4-y change in smoking status. When stratifying by BMI, physical activity, age, and baseline dietary insulinemic or inflammatory potential, we adjusted for the continuous variable within strata of the potential effect modifier, e.g., adjusting for continuous physical activity among men with physical activity below the median. The sample sizes in the strata of the potential effect modifiers (listed in order of the 4-y intervals: 1986–90, 1990–94, 1994–98, 1998–2002, 2002–06, 2006–10) were as follows: normal weight (BMI <25 kg/m2): 9855, 5955, 3396, 2251, 1404, 933; overweight or obese (BMI ≥25): 10,603, 6819, 4890, 3517, 2368, 1522; high physical activity (above or equal to median, 20.8 MET-h/wk): 10,240, 6468, 4209, 2926, 1969, 1262; low physical activity (below median): 10,218, 6306, 4077, 2842, 1808, 1163; age ≥55 y: 6734, 4949, 3766, 3571, 3773, 2455; age <55 y :13,724, 7825, 4520, 2156, no man was <55 y after 2002; ever smokers: 9735, 5788, 3599, 2406, 1471, 933; never smokers: 10,000, 6967, 4651, 3343, 2292, 1511; baseline EDIH score below median score: 10,312, 6386, 4146, 3025, 1997, 1238; baseline EDIH score above or equal to median score: 10,146, 6388, 4140, 2743, 1776, 1217; baseline EDIP score below median score: 10,400, 6584, 4328, 3071, 2077, 1367; baseline EDIP score above or equal to median score: 10,058, 6190, 3958, 2697, 1696, 1088. EDIH, empirical dietary index for hyperinsulinemia score; EDIP, empirical dietary inflammatory pattern score; MET-h/wk, metabolic equivalent hours per week.