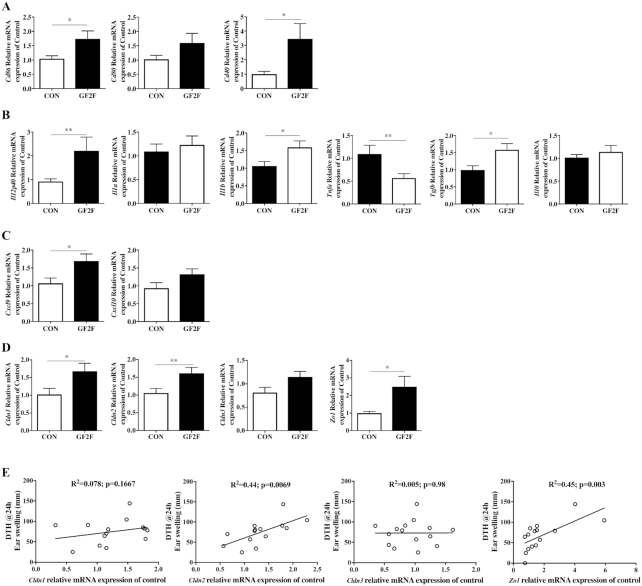
FIGURE 3.
Effects of GF2F diet on the expression of (A) DC surface markers Cd86, Cd80, and Cd40; (B) cytokines Il12p40, Il1a, Il1b, Tnfa, Tgfb, and Il10; (C) chemokines Cxcl9 and Cxcl10; and (D) tight junction–related genes Cldn1, Cldn2, Cldn3, and Zo1 in the ileum of vaccinated mice. (E) Correlation between tight junction–related genes and DTH response. The Mann-Whitney U test was used for panels A–D. Data are presented as mean ± SEM for n = 7–9/group. Significantly different from CON: *P < 0.05; **P < 0.01. Pearson's correlation was used for panel (E). DC, dendritic cell; DTH, delayed type hypersensitivity; GF2F, scGOS/lcFOS/2′FL (2′FL, 2′-fucosyllactose; FOS, fructo-oligosaccharides; GOS, galacto-oligosaccharides; lc, long chain; sc, short chain); ns, not significant.

