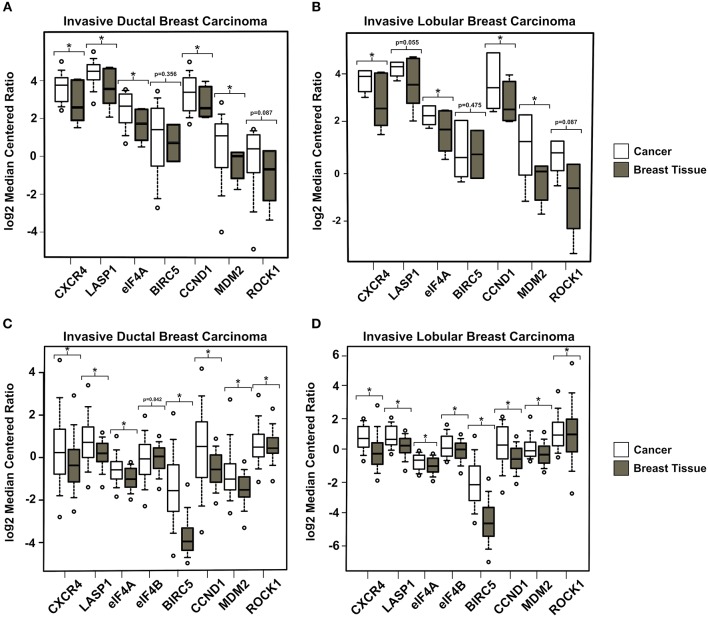
Figure 1.
The CXCR4-LASP1-eIF4A/B Axis is Upregulated in Breast Carcinoma Patients. Gene expression data was obtained and analyzed using Oncomine.com. Two representative datasets were selected. Box and whisker plots of the log2 median centered ratio (fold change) are shown for each. (A) Radvanyi Breast Invasive Ductal Carcinoma (n = 31 for CXCR4, LASP1, eIF4A, and CCND1. n = 28 for BIRC5 and ROCK1. n = 27 for MDM2) vs. Breast Tissue (n = 9 for CXCR4, LASP1, eIF4A, and CCND1. n = 2 for BIRC5. n = 5 for MDM2 and ROCK1). (B) Radvanyi Breast Invasive Lobular Carcinoma (n = 7 for CXCR4, LASP1, eIF4A, and CCND1. n = 2 for BIRC5. n = 6 for MDM2 and ROCK1) vs. Breast Tissue (n = 9 for CXCR4, LASP1, eIF4A, and CCND1. n = 2 for BIRC5. n = 5 for MDM2 and ROCK1). (C) TCGA Breast Invasive Ductal Carcinoma (n = 389) vs. Breast Tissue (n = 61). (D) TCGA Breast Invasive Lobular Carcinoma (n = 36) vs. Breast Tissue (n = 61). * Indicates p < 0.05 as evaluated by student's t-tests.

