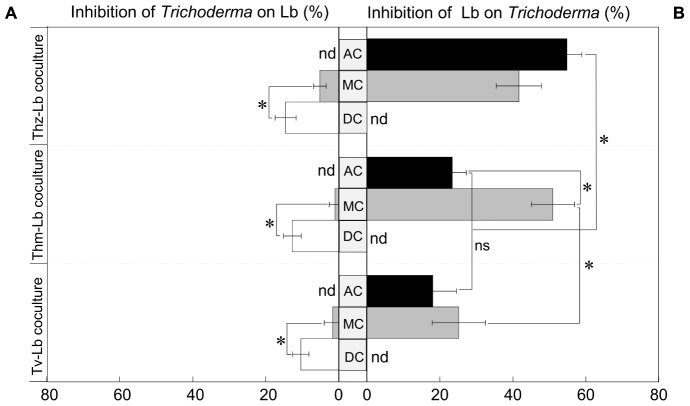
FIGURE 2.
Growth inhibition of (A) the three Trichoderma species on Lb and (B) vice versa. Black bar denotes the growth inhibition in air contact (AC) co-cultures, gray bar denotes the growth inhibition in media contact (MC), white bar denotes the growth inhibition in direct contact (DC); nd, not detected. Significances are denoted as asterisks (one-way ANOVA and Duncan’s test, p < 0.05), ns, no significance; mean ± SEM, n = 6.

