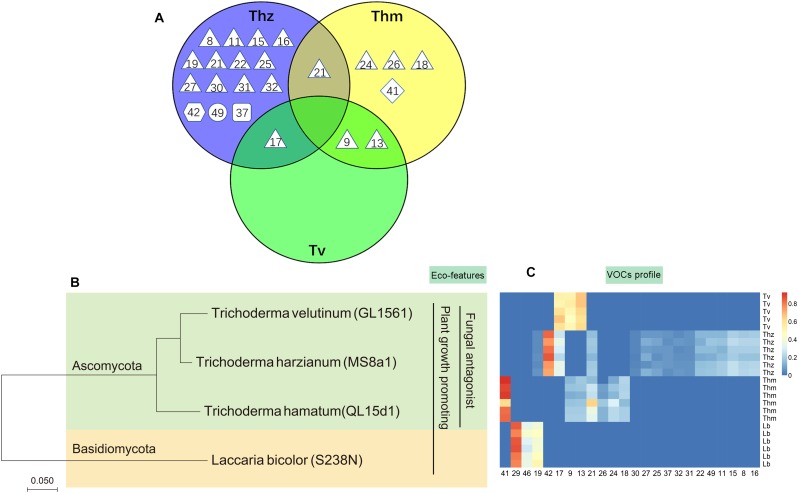
FIGURE 3.
Comparison of volatile organic compound profiles of T. harzianum (Thz), T. hamatum (Thm), and T. velutinum (Tv), and evolutionary relationship of the taxa. (A) Venn diagram depicting the VOC profiles of the Trichoderma species. Shape of the legend: diamond: monoterpene; hexagon: oxygenated monoterpene; triangle: sesquiterpene, square: oxygenated sesquiterpene; circle: other VOCs. The numbers refer to the compounds listed in Table 1. (B) Evolutionary relationships of taxa presented in a phylogenetic tree. The evolutionary history was inferred using the neighbor-joining method (Saitou and Nei, 1987). (C) Heat map analysis of the VOCs from the Trichoderma species. Data were Hellinger-transformed prior to heat map analysis. Compound numbers refer to Supplementary Table S2.

