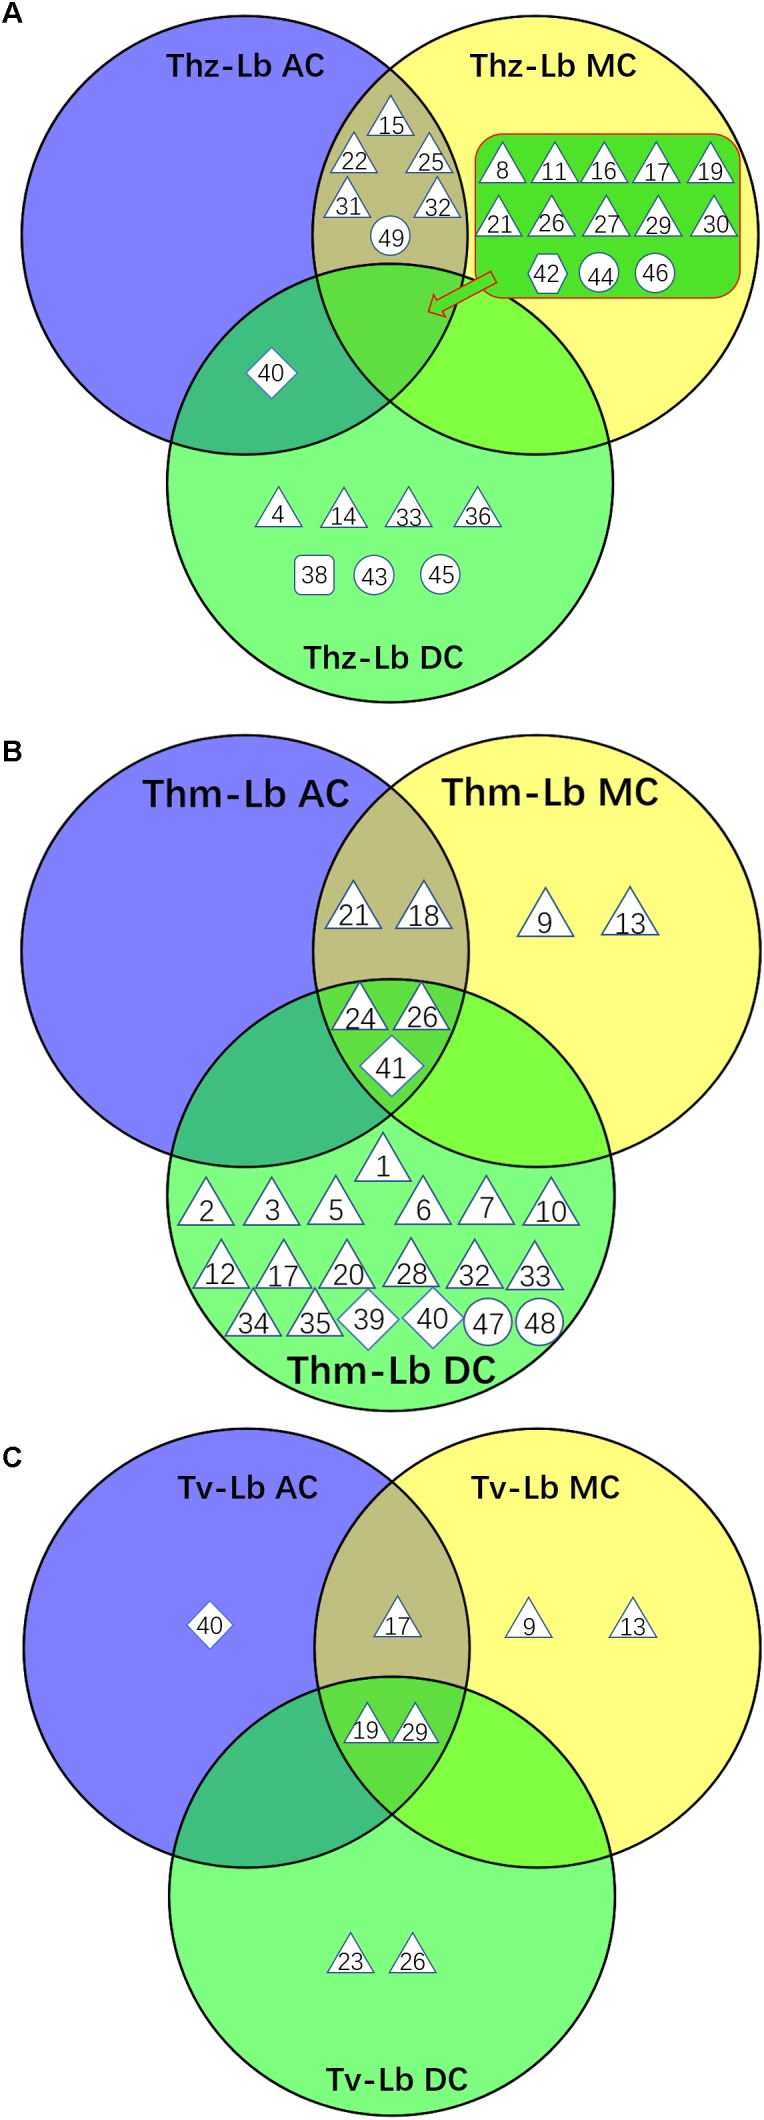
FIGURE 4.

Venn diagram depicting the VOC profiles from the co-cultures of three Trichoderma species with L. bicolor. (A) VOCs from three T. harzianum – L. bicolor co-cultures, (B) VOCs from three T. hamatum – L. bicolor co-cultures, (C) VOCs from three T. velutinum – L. bicolor co-cultures. Shape legend: diamond: monoterpene; hexagon; oxygenated monoterpene; triangle: sesquiterpene, square: oxygenated sesquiterpene; circle: other VOCs. The numbers refer to the compounds listed in Supplementary Table S2.
