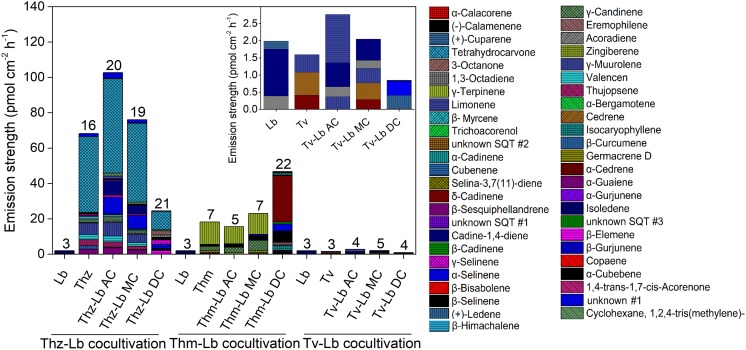
FIGURE 5.
The volatile organic compound profiles of T. harzianum (Thz), T. hamatum (Thm), T. velutinum (Tv), and L. bicolor (Lb) alone and each Trichoderma strain in different co-cultivation set-ups with Lb. For further information on the abbreviations please see Figure 1. The numbers on the bars indicate the total individual VOCs detected. Insert: Magnification of the VOC profile of Tv and sole Lb culture. Emission rates of each compound calculated based on the fungal area and collection duration of VOCs; values are means of 6 replicates.

