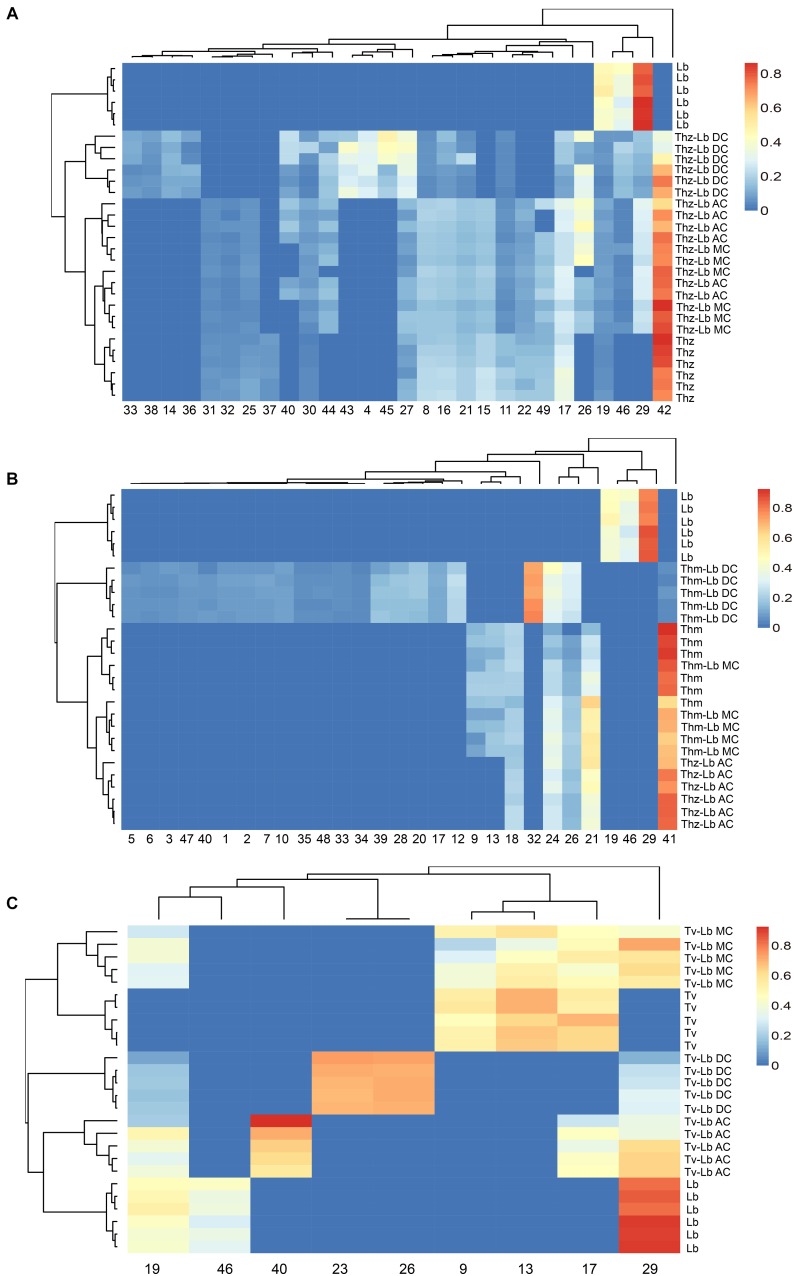
FIGURE 6.
Heat map clustering of VOC profiles from T. harzianum (Thz), T. hamatum (Thm), T. velutinum (Tv), L. bicolor (Lb), and Trichoderma- Lb co-cultures. (A) VOC profiles of Thz, Lb and their co-cultures; (B) VOC profiles of Thm, Lb and their co-cultures; (C) VOC profiles of Tv, Lb and their co-cultures. Data were Hellinger-transformed prior to clustering. NC, no contact; AC, airborne contact; MC, media contact; DC, direct contact. Compound numbers refer to Supplementary Table S2.

