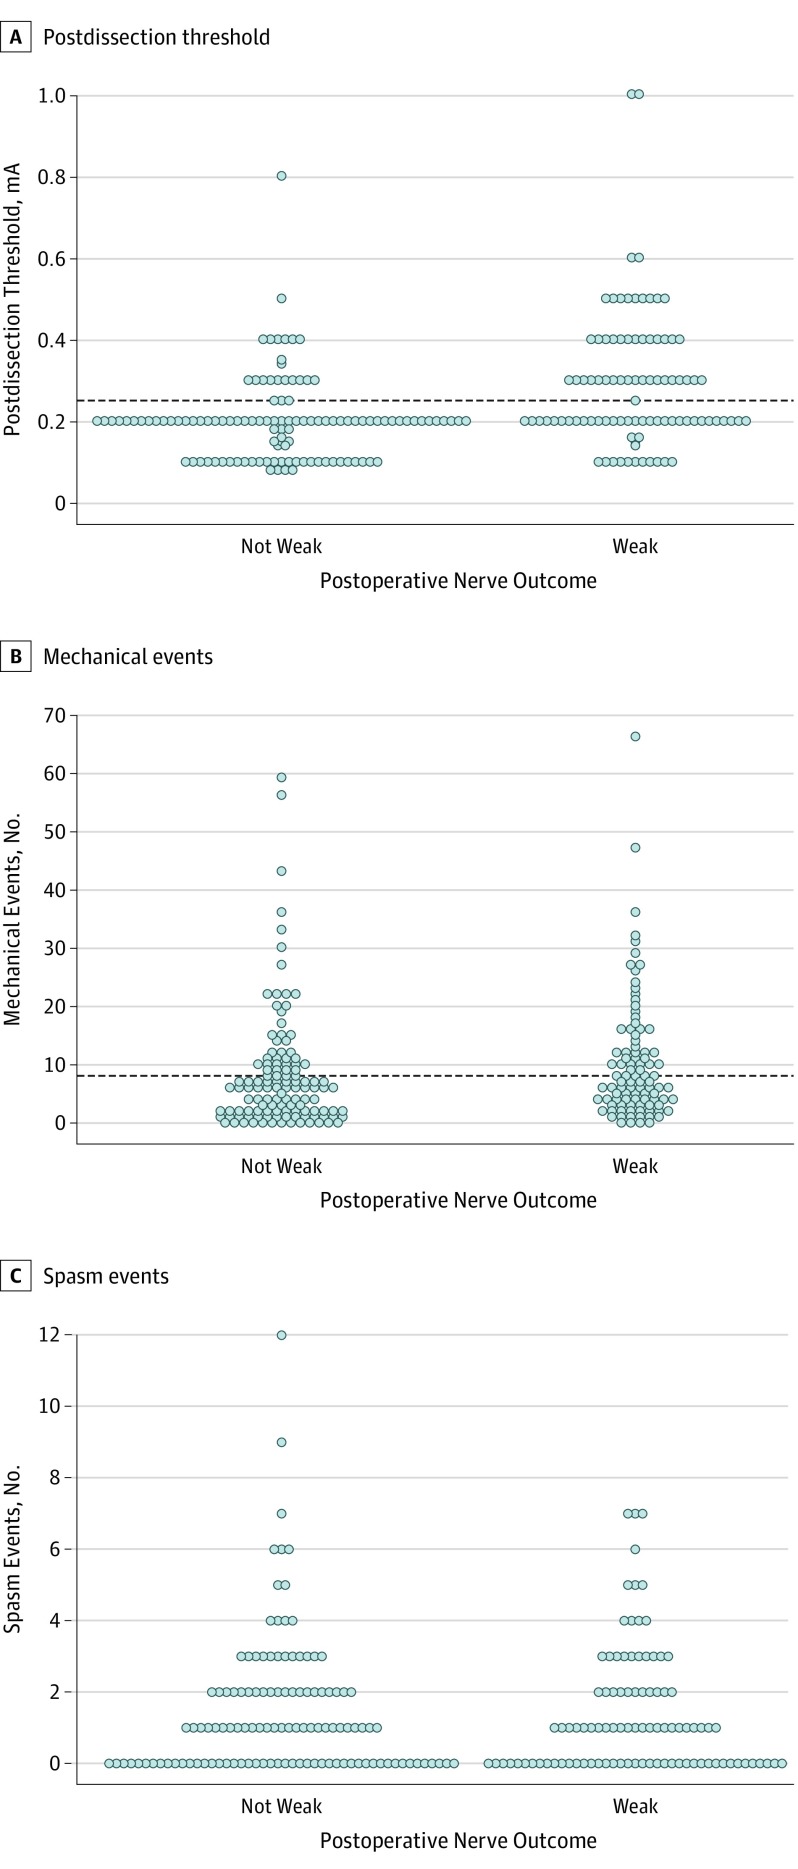
Figure 2. Postdissection Thresholds, Mechanical Events, and Spasm Events.
Each dot represents a single patient’s postdissection threshold value (A), number of intraoperative mechanical events (B), and number of intraoperative spasm events (C). The horizontal line represents the optimal cutoff value associated with postoperative nerve outcome. A value above the horizontal line suggests early postoperative nerve weakness. No cutoff value is provided for spasm events (C) because it was not statistically significant. mA Indicates milliamperes.

