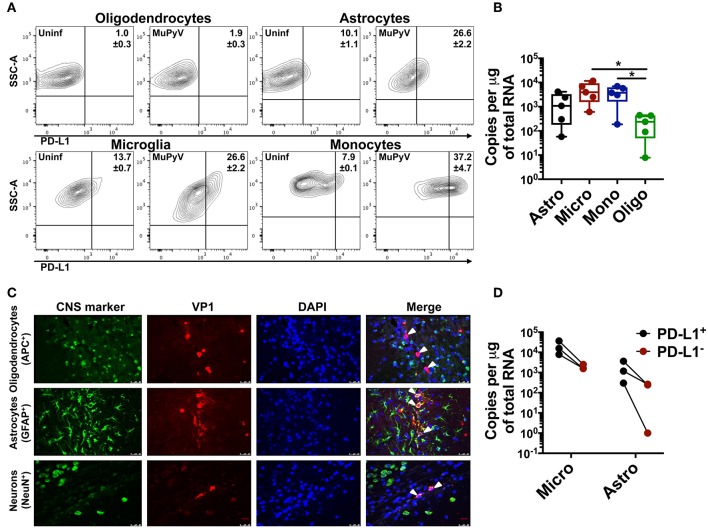
Figure 1.
Neural cells express PD-L1. (A) Representative contour plots with frequency of PD-L1+ oligodendrocytes (CD11bneg/CD45neg/O4+), astrocytes (CD11bneg/CD45neg/GLAST+), microglia (CD11bhi/CD45int) and infiltrating monocytes (CD11bhi/CD45hi) from mock inoculated controls and MuPyV-infected mice at 8 dpi. The gates were drawn on the basis of the fluorescence minus one (FMO) controls. (B) LT-Ag mRNA copy number from FACS-purified astrocytes (Astro), microglia (Micro), infiltrating monocytes (Mono), and oligodendrocytes (Oligo). Ct values were normalized to the amount of total RNA taken for cDNA synthesis. Each point represents data from a pool of 3 mice. (C) Fluorescence photomicrographs of FFPE brain tissue sections from mice euthanized at 4 dpi stained with antibodies specific for the indicated CNS cell markers (green) and for MuPyV capsid protein VP1 (red). Nuclei were counterstained with DAPI (blue). White arrows in merged images indicate VP1+ cells (magnification 400X). (D) LT-Ag mRNA copy numbers from FACS-purified PD-L1+ and PD-L1− microglia and astrocytes. Ct values were normalized with the Ct value of TBP mRNA for each cell type between the PD-L1+ and PD-L1− samples. Each point connected by a line indicates cells from a pool of 3 mice. Data are cumulative from two independent experiments with 2–4 mice per group. Two-way ANOVA with Tukey multiple comparison test was performed. Values represent mean ± SD; *p ≤ 0.05.

