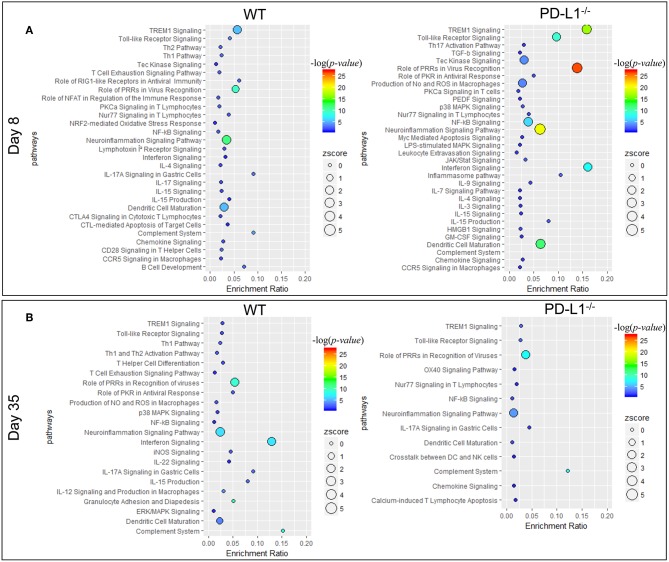
Figure 5.
PD-1 signaling alters inflammatory pathways in the brain during MuPyV infection. Pathway enrichment analysis of the differentially expressed genes between MuPyV-infected WT vs. mock-inoculated WT control (left panel), and MuPyV-infected PD-L1−/− vs. mock-inoculated PD-L1−/− control brain (right panel) at 8 dpi (A) and 35 dpi (B) using IPA software. The y-axis represents pathway and the x-axis represents enrichment ratio. Bubble size represents the z-score and color represents the -log(p-value) calculated by Fisher's exact test.

