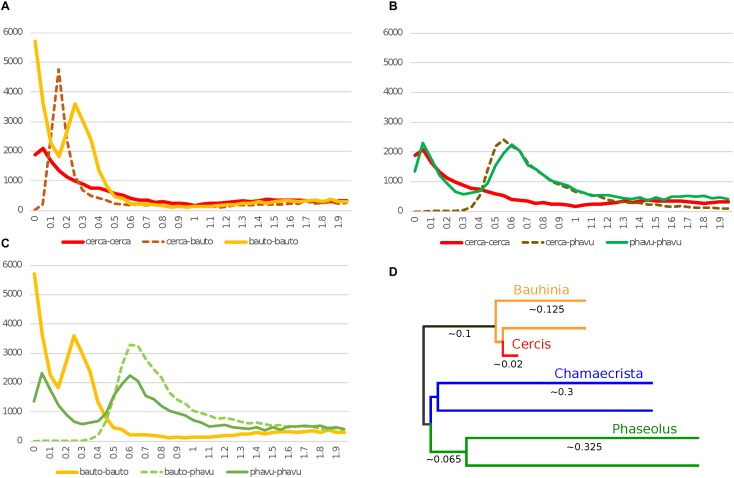
FIGURE 1.
Histograms of Ks values for top gene-pair comparisons for Cercis canadensis (“cerca”), Bauhinia tomentosa (“bauto”), and Phaseolus vulgaris (“phavu”). In Ks plots (A–C), solid lines are for self-comparisons (e.g., for Cercis gene-pairs), and dotted lines are for between-species comparisons (e.g., between Cercis and Bauhinia). The schematic tree in panel D is an idealized distance tree in which each OTU represents an “average” gene: either a single copy in Cercis, or each of two homoeologs created by unique WGD events in the remaining taxa. Branch lengths are calculated from pairwise modal Ks values in panels A–C.

