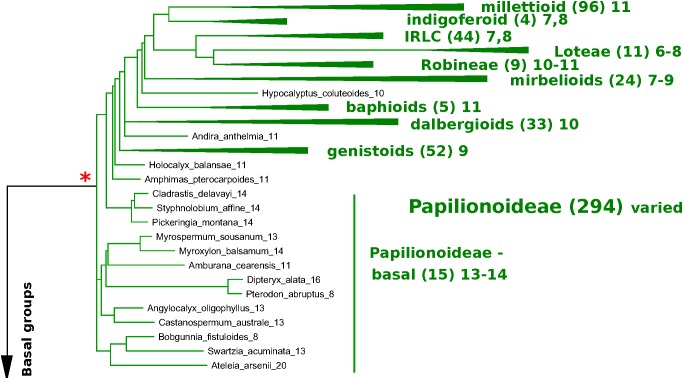
FIGURE 6.
Papilionoid portion of the matK-based species phylogeny for representative species in the legumes, with chromosome count data (Figure 6, 7). matK-based species phylogeny for representative species in the legumes (derived from Legume Phylogeny Working Group et al., 2017), with chromosome count data. Only species for which chromosome counts are available are shown, with the exception of the Cercidoideae (Figure 7), where additional species are shown for context in that subfamily. Chromosomal counts are given as the mode for the indicated genus, where there are differences in the genus. Some particularly well-represented clades have been collapsed and are represented by a colored triangle. The number of genera with counts is given in parentheses – for example, 96 genera are represented in the triangle representing the millettioid clade (top of Figure 6), and 47 genera are represented in the triangle representing the Mimosoid clade (top of Figure 7). Red asterisks indicate polyploidy events – either known (e.g., Papilionoideae) or hypothesized (e.g., Dialioideae).

