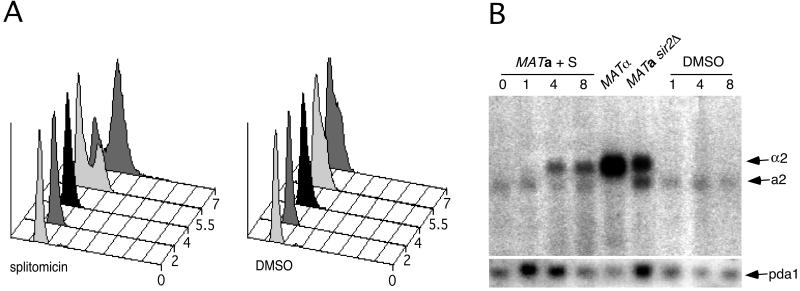
Figure 4.
(A) Cell cycle analysis of α factor arrested MATa cells treated with splitomicin. Logarithmically growing MATa cells were treated first with α factor for 90 min. At time 0, splitomicin (20 μM) or DMSO was added to the culture. DNA content of the cells was determined by flow cytometry at several time points after the addition of splitomicin. (B) α2 mRNA expression from the silent HML locus in G1-arrested cells treated with splitomicin. A strain containing the galactose-inducible CLN3 gene in which genomic G1 cyclin genes were deleted [MATa cln1Δ, cln2Δ, cln3Δ, GAL-CLN3 (35)], was arrested in G1 by exposure to glucose for 90 min. Splitomicin (20 μM) or DMSO was added to the culture of these G1-arrested cells, and the expression of MATα from the silent HML locus was assessed at several time points. Both splitomicin- and DMSO-treated cells remained arrested in G1 as judged by flow cytometry (data not shown). The RNA from MATα and MATa sir2Δ cells is included for comparison. The weak lower molecular weight band is caused by cross hybridization to a2 mRNA. The blot was stripped and reprobed for the PDA1 mRNA as a loading control.

