Figure 1.
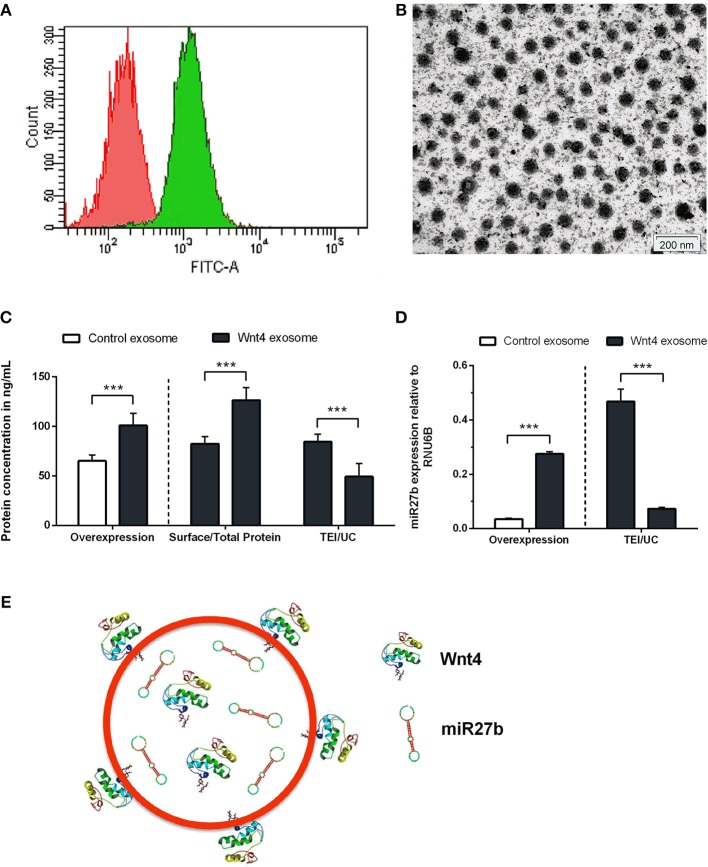
Characterization of transgenic exosomes. Flow-cytometric analysis of control (shown in red) and GFP+ Wnt4 over-expressing TECs (thymic epithelial cells) (shown in green) is presented (A). FITC-A corresponds to FL1 channel where GFP-emitted fluorescence is detected. Please note that FITC-A scale is logarithmic. Transmission electron micrograph shows TEI exosomes of approx. 50–100 nm in size (B). Wnt4 protein (C) and miR27b RNA (D) levels of TEI (total exosome isolate) and UC (ultracentrifuged) exosomes are shown as obtained by ELISA and TaqMan qPCR, respectively. From left to right column pairs show level of over-expression, surface/total content, and TEI/UC content, as applicable. Absolute concentration is shown in ng/ml for Wnt4 (C) and absolute copy number is shown for miR27b relative to rnu6b (D). Eight (C) and three (D) replicates were used for statistical analysis. Significant differences are shown by asterisks (n/a for not applicable, ns for not significant, *p ≤ 0.05, **p ≤ 0.01, ***p ≤ 0.001) and were calculated using independent samples t-test. For exact numerical values and statistical analysis please refer to Supplementary Material. Representative drawing of a DiI lipid-stained (red) Wnt4-transgenic exosome showing Wnt4 (surface and internal) content and miR27b (internal) cargo (E).

