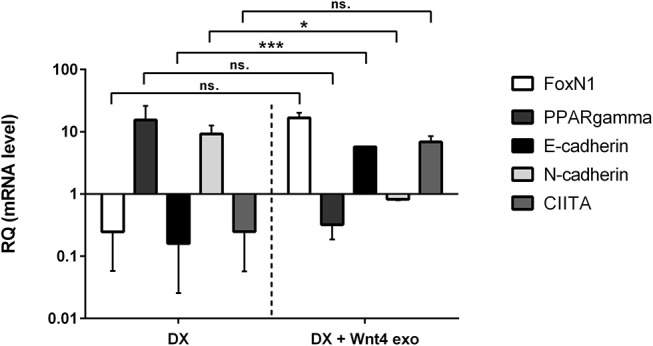
Figure 2.

In vitro biological effect of transgenic exosomes. Gene expression changes of FoxN1, PPARgamma, E-cadherin, N-cadherin, and CIITA are shown as measured by SYBR-green qPCR following steroid (DX)-treatment alone (DX, left half of figure), or in combination with transgenic exosomes (DX + Wnt4 exo, right half of figure). Three samples of each were used for statistical analysis. Fold change (relative quantity or RQ) expression is shown, where RQ = 1 represents baseline control. RQ is relative to control level (left half of figure), or relative to DX-treatment (right half of figure). Please note that Y-axis is logarithmic. Significant differences are shown by asterisks (n/a for not applicable, ns for not significant, *p ≤ 0.05, **p ≤ 0.01, ***p ≤ 0.001) and were calculated using independent samples t-test. For exact numerical values and statistical analysis please refer to Supplementary Material.
