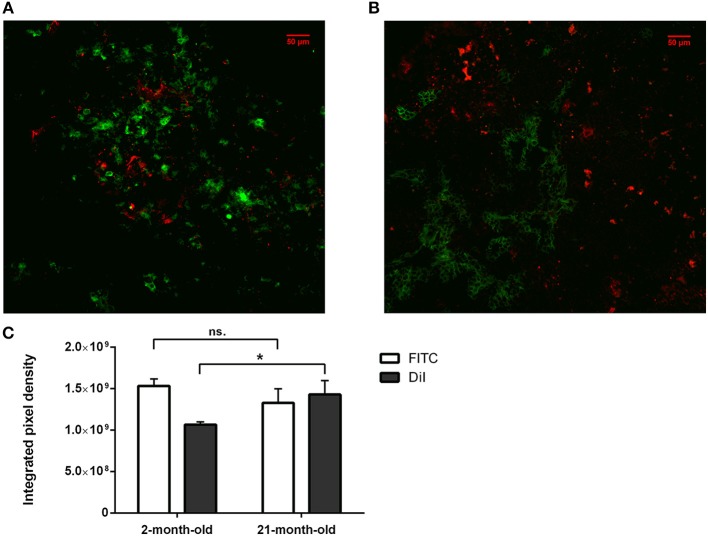
Figure 3.
In vitro binding and distribution of transgenic exosomes. Frozen mouse thymic sections from young adult (2 months, A) and senior adult (21 months, B) are shown. Sections were labeled using EpCAM1-FITC (shown in green). Transgenic exosomes were pre-stained using DiI lipid stain (shown in red). Representative slide is presented. Data were calculated using five slides each. Integrated pixel density values are shown for EpCAM1 (shown in green) and DiI lipid stain (shown in red) (C). Significant differences are shown by asterisks (n/a for not applicable, ns for not significant, *p ≤ 0.05, **p ≤ 0.01, ***p ≤ 0.001) as obtained using independent sample t-test. Data were calculated using five slides each. For exact numerical values and standard deviation please refer to Supplementary Material.

