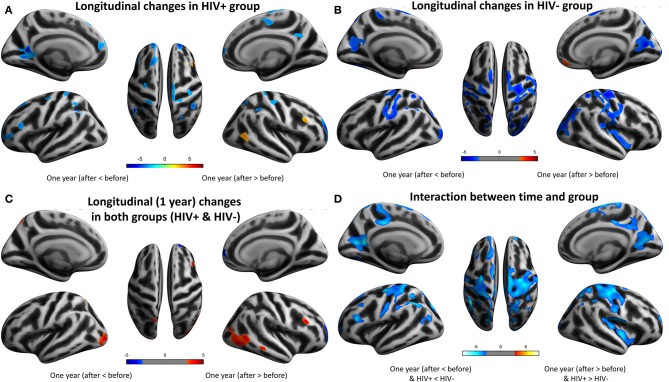
Figure 4.
Longitudinal changes on cortical thickness (CT) after 1 year. Clusters showing significantly (corrected P < 0.05) lower (blue) and higher (red) CT changes after 1 year. (A) Clusters showing lower and higher CT regions in HIV+ group children. (B) Clusters showing significantly lower and higher CT regions in HEU group children. (C) Put together the two groups for statistical analysis and showing significantly lower regions more obviously than higher regions of CT after 1 year. (D) In assessing the time and interactions between the two groups, clusters showing widely areas of CT significantly reduced.

