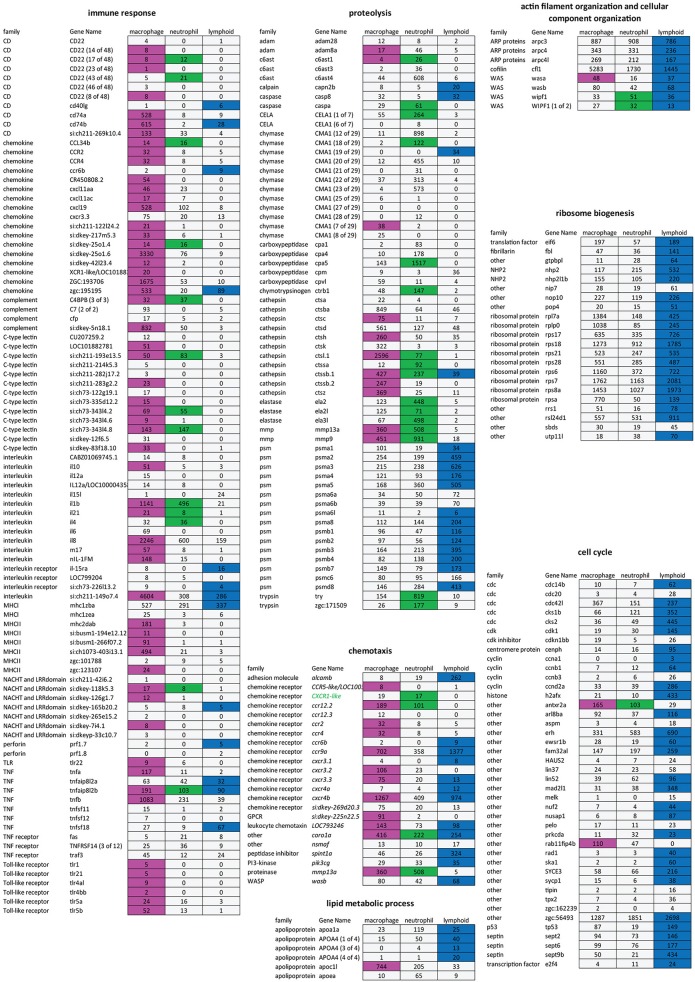
Figure 3.
Different gene sets expressed in macrophage, neutrophil, and lymphoid cell population. Expression table of selected genes belonging to different GO terms. First, second and third columns correspond to macrophage, neutrophil, and lymphoid cell populations, respectively. Magenta, green, and blue cells represent genes enriched [log2 (fold change) > 1, P-adj < 0.01] in macrophages, neutrophils, or lymphoid cells compared to respective fluorescent-negative background cells. Numbers are expression levels expressed in TPMin the fluorescence positive cell fractions. Gray cells are non- enriched genes (P-adj ≥ 0.01).

