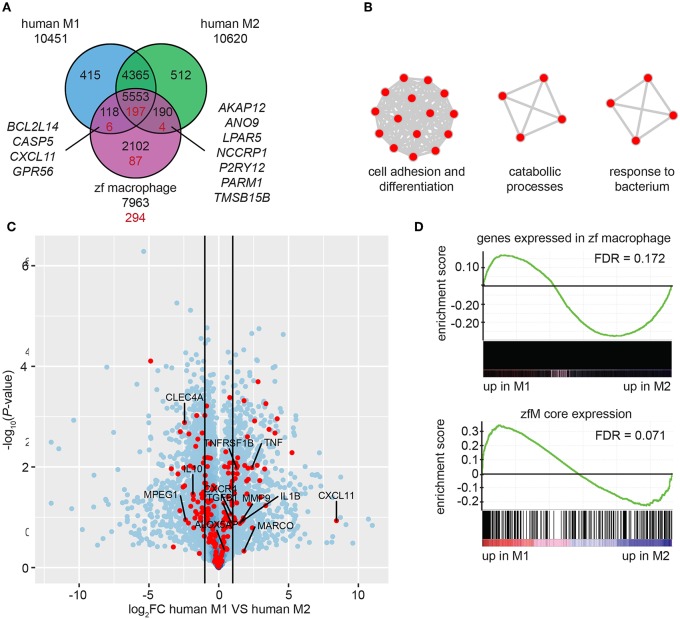
Figure 4.
Zebrafish larval macrophages have a gene signature similar to human M1 and M2 polarized macrophages. (A) Overlap of the genes detected in human M1 (blue) or M2 (green) polarized macrophages and of the human homologs of the zebrafish core macrophage data set (magenta). Black number correspond to the comparison between genes expressed in human or zebrafish cells (TPM ≥ 3) and red numbers correspond to the comparison of gene expressed in human cells and specifically enriched in zebrafish macrophages [log2 (fold change) ≥ 1, P-adj < 0.01]. (B) Network visualization of GO enrichment analysis of human homologs of zebrafish macrophage enriched genes not detected in the dataset of human M1 and M2 in vitro polarized macrophages using BiNGO and EnrichmentMap. Red nodes represent GO terms. Network legend is similar to Figure 1C. (C) Volcano plot showing the P-value (-log10-transformed) as a function of the fold-change (log2-transformed) between human M1 and M2 gene expression level of the gene set from Beyer et al. (40). Red dots are genes with a human homolog detected in the zebrafish macrophage core dataset. (D) Gene Set Enrichment Analysis (GSEA) plots of gene expression changes in human M1 in vitro polarized macrophages compared to human M2 in vitro polarized macrophages from Beyer et al. (40). Gene sets used for the analyses are genes expressed in zebrafish macrophages (TPM ≥ 3) (top) and genes from the zebrafish macrophage core dataset (lower).

