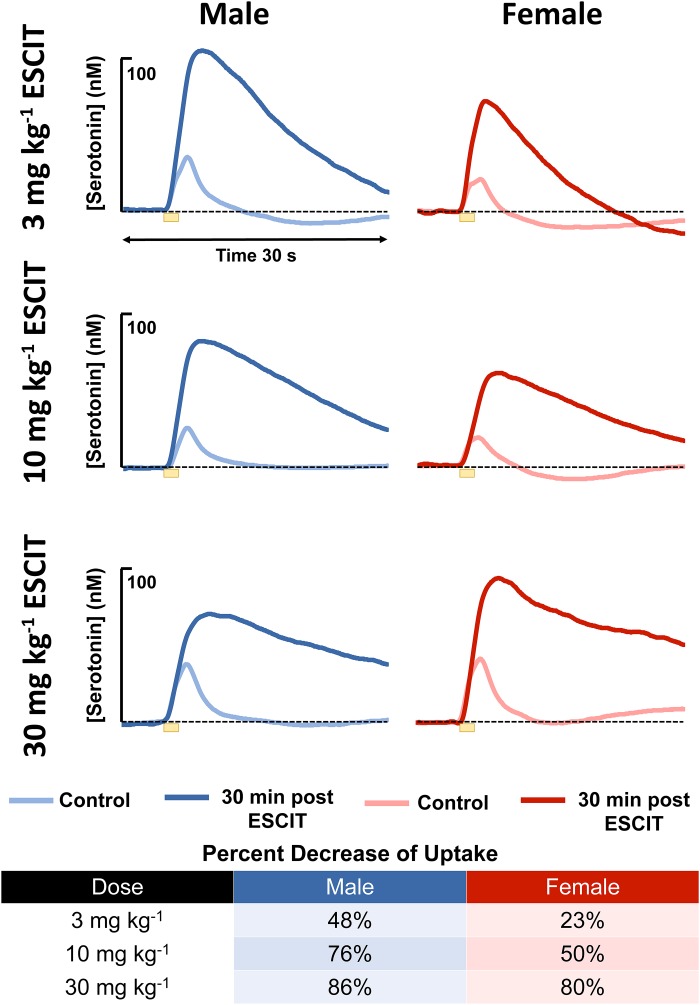
FIGURE 4.
The male (blue) and female (red) evoked serotonin signals are shown (n = 4 for each). A lighter color is shown to indicate control release and a darker shade is used to denote response 30 min following i.p. ESCIT administration (3, 10, and 30 mg kg-1). The table lists percent decrease of reuptake in males and females at the three doses.

