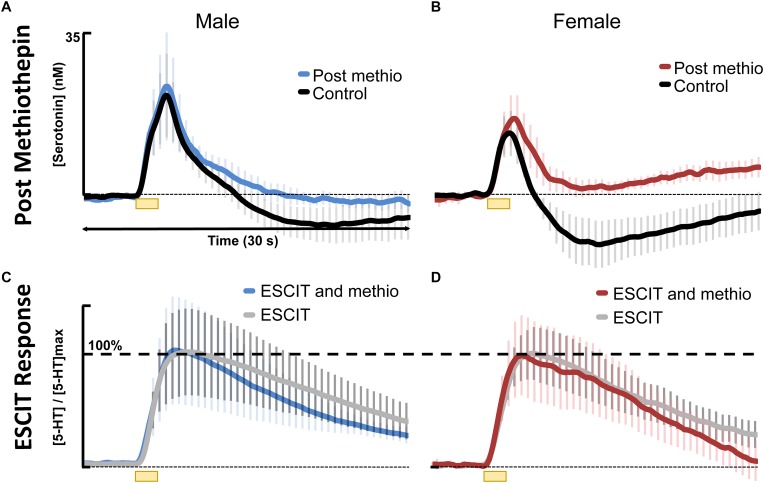
FIGURE 6.
Control stimulated 5HT is shown in black for (A) males (n = 4) and (B) females (n = 4) and 30 min following 0.1 mg kg-1 methiothepin (methio) are shown for (A) males (n = 4) in blue and (B) females (n = 4) in red. Post methiothepin pretreatment ESCIT (10 mg kg-1) response is shown for (C) males in blue and (D) females in red. These are normalized to ESCIT responses seen in Figure 4, shown in gray for (C) males and (D) females.

