
Fig. 1.
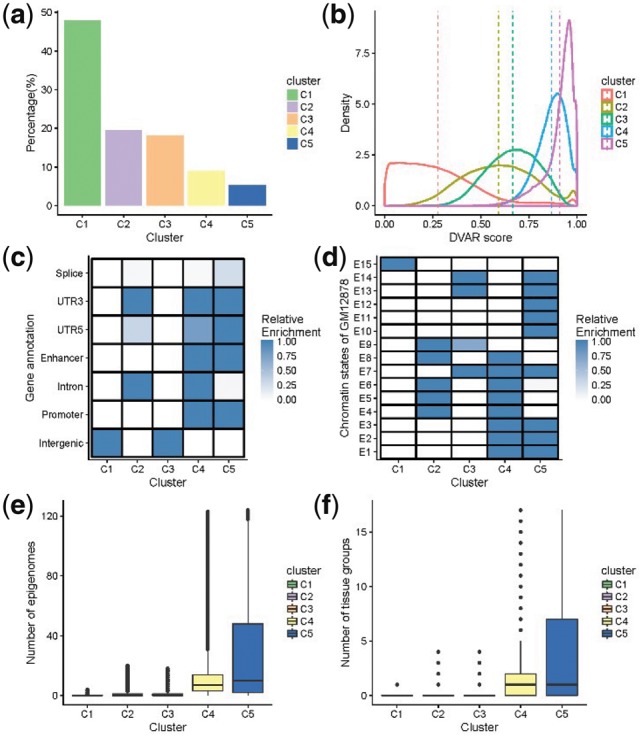
Different genomics patterns of DVAR-clusters C1∼C5 in 2 000 000 non-coding variants randomly sampled from the 1000 Genomes Project. (a) The percentage of each cluster of the non-coding variants. (b) The distributions of DVAR-scores of non-coding variants in different clusters. (c) Enrichment of DVAR-clusters with gene-based regions: Splice, 3′ UTR, 5′ UTR, Enhancer, Promoter Intron and Intergenic region, extracted from UCSC database. The darkness of the blue color indicates the relative enrichment with darker blue representing higher significance [−10log10 (Fisher exact P-value)] and vice versa. (d) Enrichment with chromatin states of GM12878 cell line identified by ChromHMM. (e) The boxplot of the numbers of active epigenomes in DVAR-clusters C1-C5 across 127 Roadmap epigenomes. (f) The boxplot of the numbers of active tissue-groups in DVAR-clusters C1∼C5 across 15 Roadmap tissue-groups (Color version of this figure is available at Bioinformatics online.)