
Fig. 3.
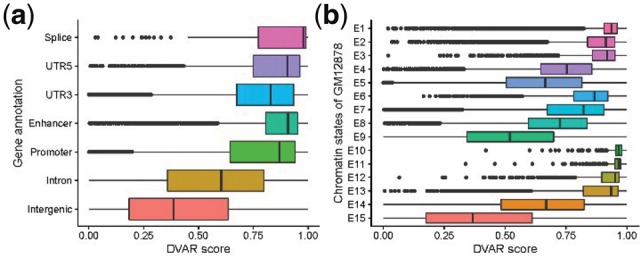
The distribution of DVAR-scores across different regulatory elements (REs). (a) DVAR-scores grouped by gene-based regions. (b) DVAR-scores grouped by 15-chromatin states of ChromHMM on GM12878 cell
Official websites use .gov
A
.gov website belongs to an official
government organization in the United States.
Secure .gov websites use HTTPS
A lock (
) or https:// means you've safely
connected to the .gov website. Share sensitive
information only on official, secure websites.
The distribution of DVAR-scores across different regulatory elements (REs). (a) DVAR-scores grouped by gene-based regions. (b) DVAR-scores grouped by 15-chromatin states of ChromHMM on GM12878 cell