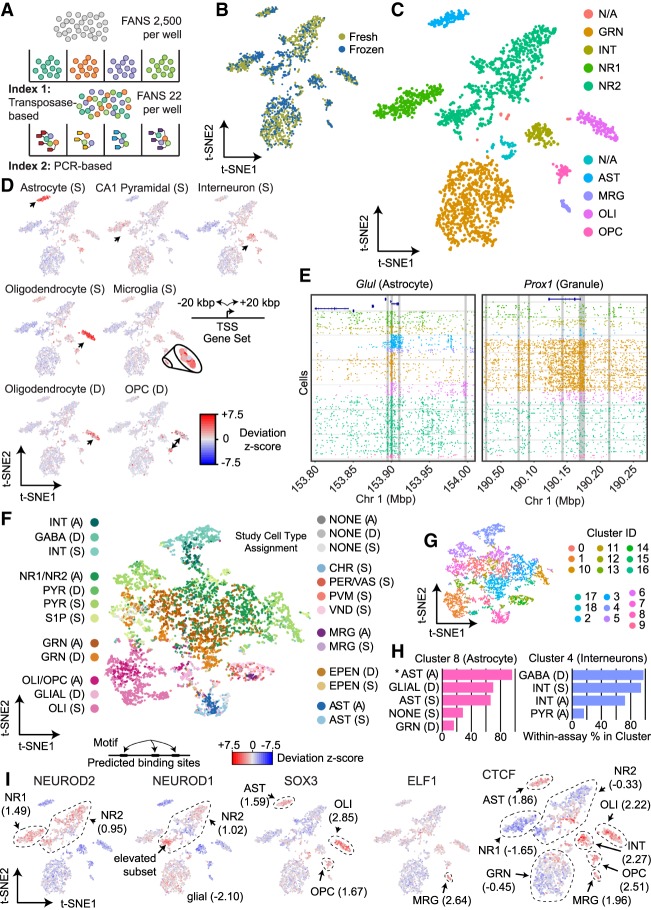
Figure 1.
sci-ATAC-seq of the murine hippocampus. (A) sci-ATAC-seq workflow. Two indexes are incorporated into library molecules for each cell, enabling single-cell discrimination. (B) LSI-t-SNE projection of single cells colored by tissue preparation method. Little variation in t-SNE space is observed between the fresh or frozen starting material. (C) LSI-t-SNE projection of cells colored by assigned cluster and cell type. (D) Enrichment of accessibility of proximal regulatory elements for marker genes as identified by single-cell RNA-seq (Smart-seq protocol [S]) (Zeisel et al. 2015) and DroNc-seq (D) (Habib et al. 2017) for each cell. The microglial population is enlarged for visibility. Black arrows indicate the cell cluster associated with the marker gene set. (E) sci-ATAC-seq read plots at Glul (astrocyte marker gene) and Prox1 (dentate granule cell marker gene). (F) Coembedding (t-SNE) of single-cell RNA-seq and DroNc-seq cells from D with our sci-ATAC-seq cells using Seurat3. Cells are colored by their study: “A” designates this study, “D” designates cells from Habib et al. (2017), and “S” designates cells from Zeisel et al. (2015). Cell type designation is from their published study (RNA) or our designations (for the sci-ATAC-seq cells). (G) PhenoGraph cluster designations on the coembedded cells. (H) Representative cluster cell compositions. The percentage of cells within each of the three assays that were assigned to the coembedding cluster using PhenoGraph is reported. For example (noted by an asterisk), in Cluster 8, 93.0% of the sci-ATAC-seq cells that were assigned to Cluster 8 were designated as astrocytes. (I) chromVAR global motif deviation Z-scores for each cell for select motifs. Dashed lines and values correspond to mean values of cell populations.

