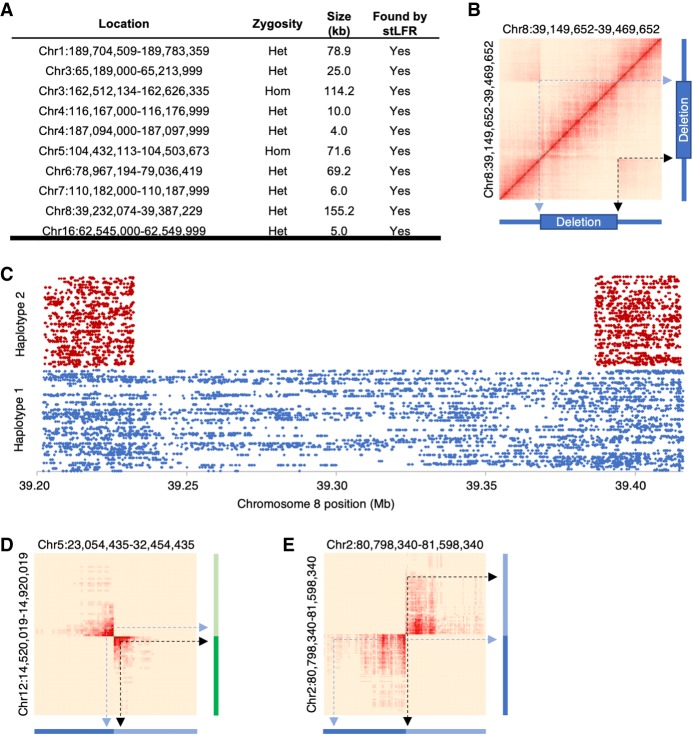
Figure 3.
SV detection. (A) Previously reported deletions in NA12878 were also found using stLFR data. Heat maps of barcode sharing for each deletion can be found in Supplemental Figure S3. (B) A heat map of barcode sharing within windows of 2 kb for a region with a ∼150 kb heterozygous deletion on Chromosome 8 was plotted using a Jaccard index as previously described (Zhang et al. 2017). Regions of high overlap are depicted in dark red. Those with no overlap in beige. Arrows demonstrate how regions that are spatially distant from each other on Chromosome 8 have increased overlap marking the locations of the deletion. (C) Cobarcoded reads are separated by haplotype and plotted by unique barcode on the y-axis and Chromosome 8 position on the x-axis. The heterozygous deletion is found in a single haplotype. Heat maps were also plotted for overlapping barcodes between Chromosomes 5 and 12 for a patient cell line with a known translocation (Dong et al. 2016) (D) and GM20759, a cell line with a known transversion in Chromosome 2 (Dong et al. 2017) (E).

