Figure 2.
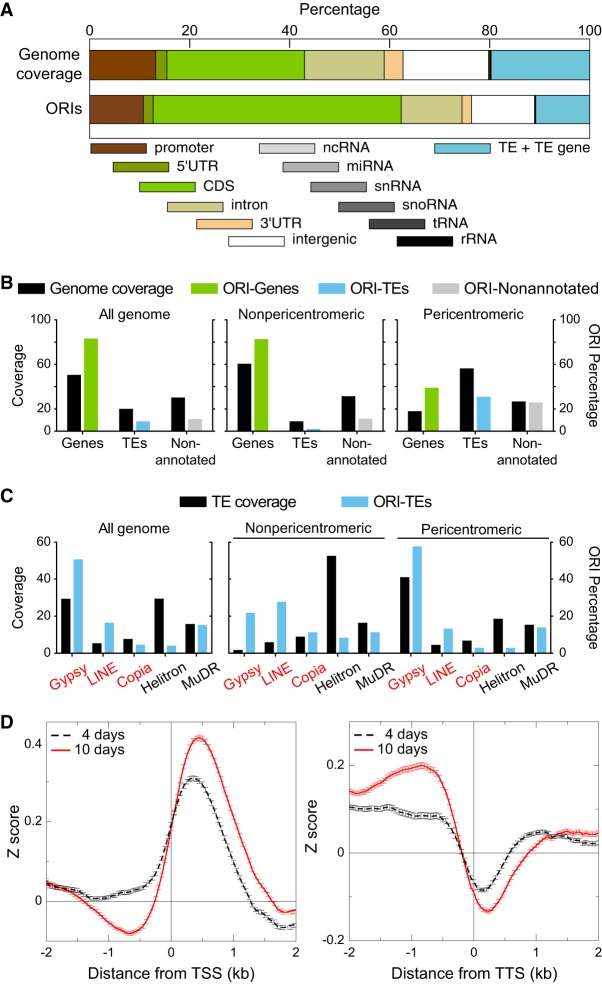
Association of ORIs with genomic elements and TE families. (A) Relationship between ORI location and genomic elements. The overlap (in base pairs) between the indicated genomic elements and each ORI was computed and expressed as a percentage. A region of 1 kb upstream of the coding sequence was considered as the promoter. Note that TEs are large genomic elements that may have one or more TE genes associated with them. Here, the class TE refers to genomic regions that contain TEs but do not overlap with TE genes. (B) Frequency distribution of ORIs colocalizing with genes (green), TEs (blue), and nonannotated regions (gray) compared with the respective nucleotide coverage. (C) Frequency distribution of ORI-TEs (blue bars) in TE families in all the Arabidopsis genome, the nonpericentromeric regions and the pericentromeric regions compared with the respective TE family nucleotide coverage of total TE nucleotides (black bars). On the x-axis, retrotransposon families (red) and DNA transposon families (black). (D) Metaplots of the combined NSS of the three independent experiments of 4-d-old and 10-d-old seedlings with respect to the transcription start sites (TSS; left) or the transcription termination site (TTS; right), oriented in both cases with the transcribed RNAs.

