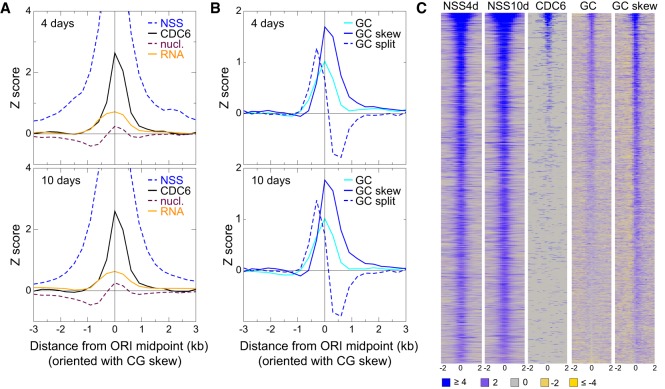
Figure 3.
Features of the local neighborhood of ORIs in whole Arabidopsis seedlings. (A) Metaplots of NSS, CDC6, transcript content (RNA), and nucleosome (nucl.) content weighted with the combined Z-score of the three independent experiments of 4-d-old (top) and 10-d-old (bottom) seedlings. The metaplots for individual scores of each experiment are shown in Supplemental Figure S3. (B) Metaplots of GC, GC skew, and GC split weighted with the combined Z-score of the three independent experiments of 4-d-old (top) and 10-d-old (bottom) seedlings. The metaplots for individual scores of each experiment are shown in Supplemental Figure S4. (C) Heatmaps of the signals (square root) of several key features around ±2 kb of the ORI midpoint (0). ORIs have been ranked according to the first principal component of the complete set of features, computed over all 2374 ORIs. The color scale applies to all panels. Note that heatmaps of other features are shown in Figures 5 and 6 (see below).

