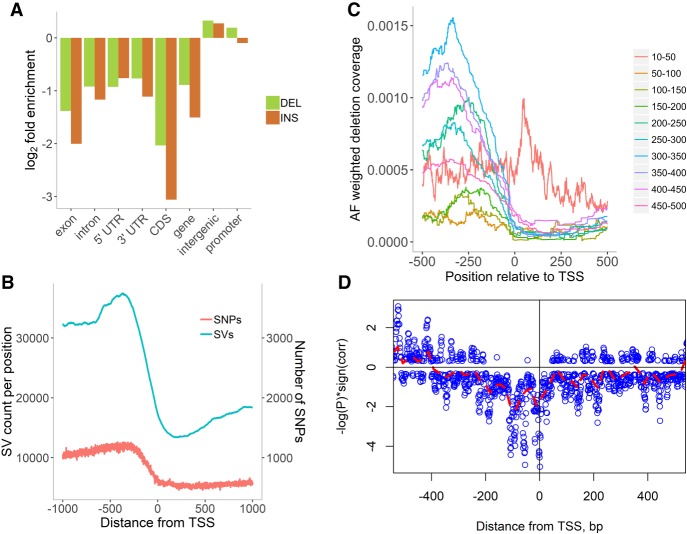
Figure 3.
SVs in genome features. (A) Enrichment/depletion of deletions (green) and insertions (orange) in various genomic regions. As expected, genic regions have fewer SVs than intergenic ones, with CDSs and exons being the most conserved regions. (B) Distribution of deletion and insertion clusters near the transcription start site (TSS). Although the total number of SNPs is much larger than SV clusters, SVs affect more positions. The bump at about −366 bp just before the core promoter is explained by longer SVs associated with transposons. (C) Distribution of the number of deletions in the vicinities of start and end of transcription and translation (Supplemental Fig. S16). (D) P-values of the independence tests between predicted TFBS and deletions. Strong anti-correlation is observed at the TSS and ∼100 bp upstream. Distribution of P-values shows that in the core promoter area ([TSS-200, TSS]), deletions and TFBS are not independent.

