Figure 3.
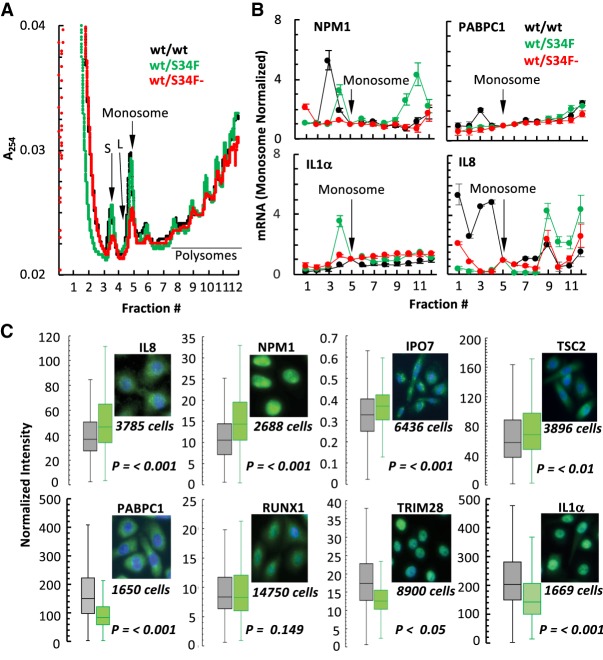
U2AF1 functions as a translational repressor in the cytoplasm. (A) 10%–50% linear sucrose gradient profile of polysomes isolated from wt/wt, wt/S34F, and wt/S34F− mutant cells. The positions of the small (S) and large (L) ribosomal subunits, monosomes, and polysomes are indicated. (B) Monosome and polysome fractions (three biological replicates) were subjected to semiquantitative RT-PCR for indicated genes, products fractionated on a 1.5% agarose gel and quantified. The mRNA in individual fractions normalized to the total in all fractions and the ratio of mRNA to monosome in the individual fractions plotted (average of three independent experiments ±SE). (C) Box plot analysis of normalized integrated fluorescence intensity (min, max, first and third quartiles, and median) after immunostaining PFA fixed wt/wt (black) and wt/S34F (green) cells for IL8, NPM1, IPO7, TSC2, RUNX1, and TRIM28. P values determined by two sided t-test.

