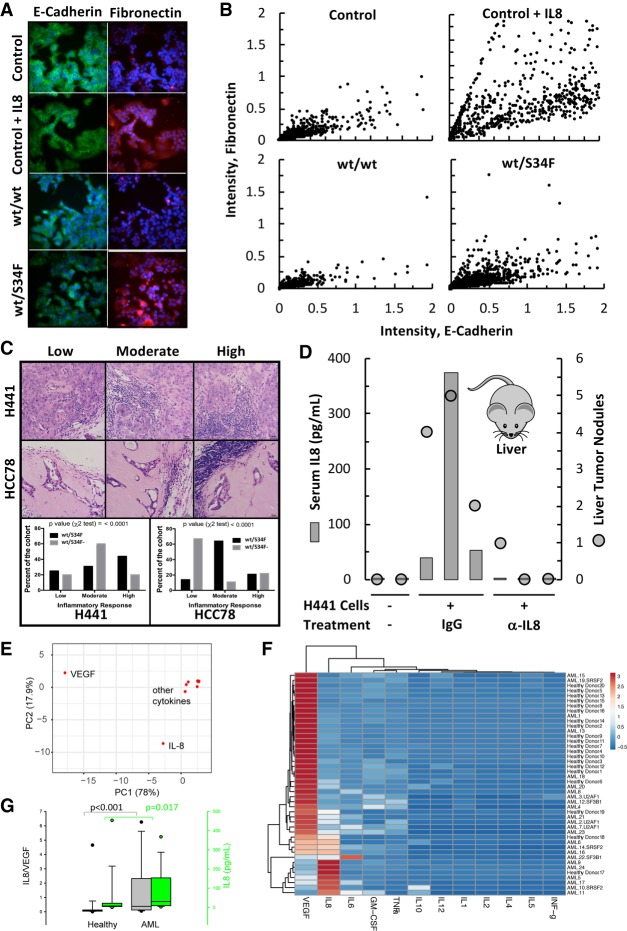
Figure 7.
IL8 can induce EMT, inflammation and tumor progression. (A) MCF-7 cells were cultured in either control, control + IL8 (1 nM), or conditioned media (EMT assay) from WT or S34F mutant cells. After 10 d in culture, cells were immunostained for E-cadherin (green) and Fibronectin (red). (B) Scatter plot showing EMT-associated changes in E-cadherin and Fibronectin expression observed by quantitative immunofluorescence detection of E-cadherin and Fibronectin in PFA fixed individual cells from A. (C) Representative H&E stained images (top panel) showing exent of peri- or intratumoral inflammation response in xenograft tumors and its quantitation (bottom panel). Scale bar, 20 µm. The number of independent tumors: H441 (wt/S34F), n = 16; H441 (wt/S34F−), n = 20; HCC78 (wt/S34F), n = 14; HCC78 (wt/S34F−), n = 9. P-values were determined by χ2 test. (D) Serum IL8 levels (gray bar) and the number of macroscopic liver nodules (black circles) from NOG mice injected (tail vein) with H441 isogenic cells, and treated with either isotype control or anti-IL8 antibodies for 10 wk (n = 3 for each treatment group). Two naïve NOG mice (the two samples on the left) were used as negative controls. (E) Principal component analysis of 12 cytokine levels in bone marrow from healthy and relapsed or refractory acute myeloid leukemia donors (RR-AML). (F) Heatmap showing the clustering of cytokine measurements. Rows are centered with unit variance scaling applied to rows. Both rows and columns are clustered using Euclidean distance and average linkage. The tree ordering for rows and columns places the higher median first. Patient and spliceosome mutational status are not part of the clustering and are indicated on the right. (G) IL8/VEGF ratio and IL8 levels from healthy and AML individuals. VEGF and IL8 account for 96% of the variation within the samples.

