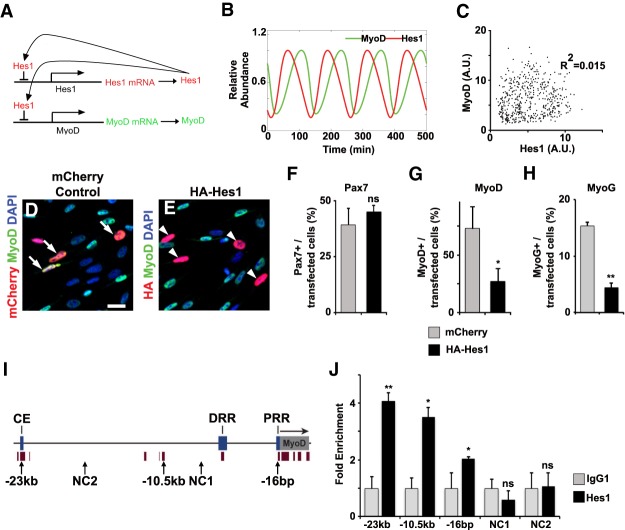
Figure 3.
Hes1 suppresses MyoD expression. (A) Scheme of the regulatory model used. Hes1 protein suppresses expression of Hes1 and MyoD genes. (B) Predicted dynamics of MyoD and Hes1 proteins using the mathematical model described in the Material and Methods. (C) Predicted levels of Hes1 and MyoD protein for 500 cells at random time points. We included noisy parameters into the prediction, which were taken from a Gaussian distribution with a standard deviation of 5% and a cutoff of three standard deviations that removed ∼0.3% of the outliers. (D,E) Proliferating muscle stem cells were transfected with a mCherry containing control construct or a HA-tagged Hes1 expression construct. Transfected cells were identified by mCherry fluorescence or anti-HA antibodies, respectively, and analyzed using MyoD specific antibodies. DAPI was used as counterstain. (F–H) Quantification of transfected cells expressing Pax7 (H), MyoD (I), or MyoG (J) (n = 3, mean ± SEM). (I) Scheme of the mouse MyoD gene, including known enhancer sequences (core enhancer [CE], distal regulatory region [DRR], and proximal region [PRR]) and an additional conserved sequence with predicted Hes1-binding sites located 10.5 kb upstream of MyoD transcription start site. NC1, NC2 correspond to the sequences used as negative controls. Brown bars below the gene and promoter represent conserved regions. (J) ChIP-PCR experiments analyzing Hes1 binding to the indicated sequences of MyoD (n = 3; mean ± SEM). Scale bars: (D,E) 500 µm. For statistical analysis, unpaired two-tailed Student's t-test was performed. (*) P < 0.05; (**) P < 0.01; (n.s.) nonsignificant.

